Figure 1
Factor Loadings
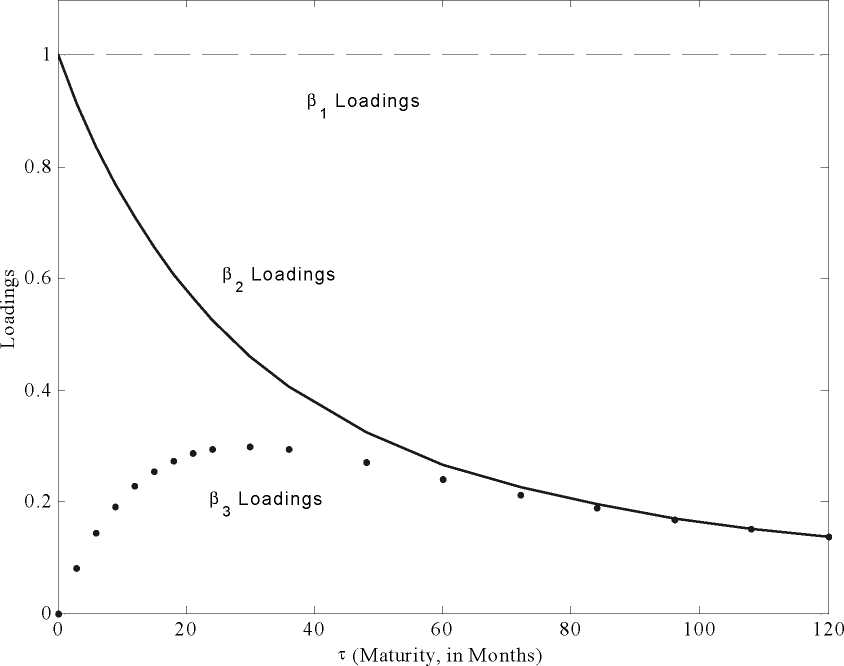
Notes to Figure 1: We plot the factor loadings in the three-factor model,
y( (τ) = β1t + β2t
tτ
1 e '
λtτ
3t
∙lτ
1 -e t
e
t
-∙ktτ
JT 1 λtr
-λlτ
1ee t 1 1ee t
where the three factors are β11, β21, and β31, the associated loadings are 1, --------, and---------e
and τ denotes maturity. We fix λt = 0.0609. ∖τ ^tτ
More intriguing information
1. The name is absent2. The Making of Cultural Policy: A European Perspective
3. Locke's theory of perception
4. The name is absent
5. The Context of Sense and Sensibility
6. The name is absent
7. TINKERING WITH VALUATION ESTIMATES: IS THERE A FUTURE FOR WILLINGNESS TO ACCEPT MEASURES?
8. Une nouvelle vision de l'économie (The knowledge society: a new approach of the economy)
9. The name is absent
10. Strengthening civil society from the outside? Donor driven consultation and participation processes in Poverty Reduction Strategies (PRSP): the Bolivian case