Women's Preferences or Delineated Policies?
Figure 1: Female Labour Force Participation in the EU, in percentage: 2003
European Female Labor Force Participation Rates: 2003
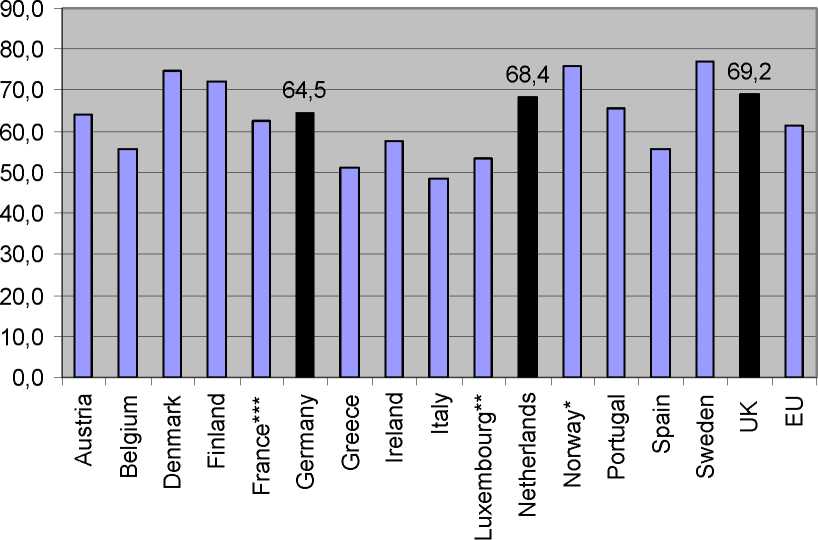
* Refers to persons aged 16 to 64.
** Refers to data from 2002.
*** Provisional estimates based on changes between 2002 and 2003 in the ratios derived from the European Labour Force Survey.
Source: OECD, 2004.
The differences in female labour market participation across these three countries become more
apparent when we consider selected age groups. As Figure 2 shows, all three countries have a
relatively similar female activity level for women aged 25-54, yet Germany has a drastically lower
participation rate for young women, and both Germany and the Netherlands have considerably
lower participation rates for women over the age of 55.
12
AIAS - UvA
More intriguing information
1. Are Public Investment Efficient in Creating Capital Stocks in Developing Countries?2. Do the Largest Firms Grow the Fastest? The Case of U.S. Dairies
3. Altruism and fairness in a public pension system
4. Correlates of Alcoholic Blackout Experience
5. Improving the Impact of Market Reform on Agricultural Productivity in Africa: How Institutional Design Makes a Difference
6. The name is absent
7. The Role of Evidence in Establishing Trust in Repositories
8. ARE VOLATILITY EXPECTATIONS CHARACTERIZED BY REGIME SHIFTS? EVIDENCE FROM IMPLIED VOLATILITY INDICES
9. WP RR 17 - Industrial relations in the transport sector in the Netherlands
10. A novel selective 11b-hydroxysteroid dehydrogenase type 1 inhibitor prevents human adipogenesis