Figure 3. Network of elementary paths and adjacent circuits linking endogenous accounts
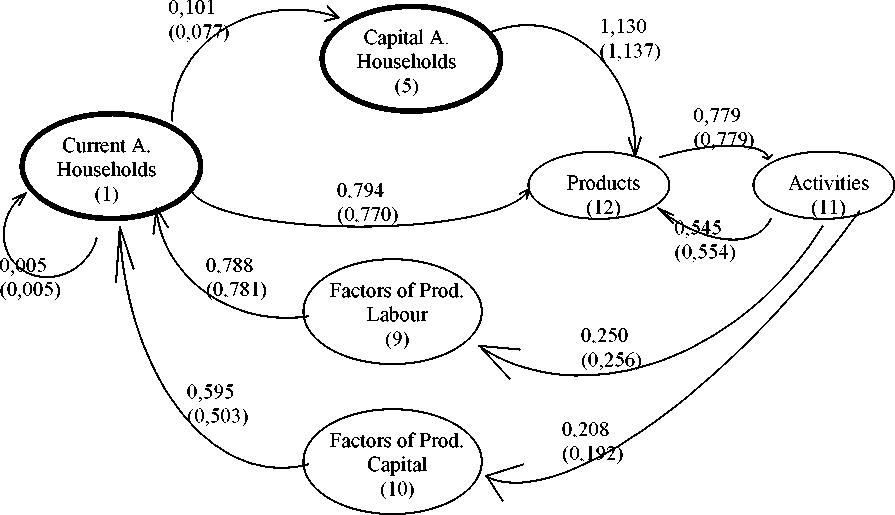
Note: This outline represents only the paths whose poles of origin and destination are the
endogenous accounts of our model.
Source: An (average expenditure propensity) matrices, calculated from the Portuguese SAMs
for 1995 and 2000 (values in brackets)
Table 11: Structural path analysis of the global influences on aggregate demand of unitary
changes in the exogenous current receipts of households
|
1995 |
1996 |
1997 |
1998 |
1999 |
2000 | |
|
Accounting Multiplier |
2.543 |
2.500 |
2.400 |
2.367 |
2.322 |
2.330 |
|
^7t I(1 → 12)1____________ |
0.337 |
0.283 |
0.220 |
0.222 |
0.181 |
0.237 |
|
IT 1(1 → 12)2___________ |
2.206 |
2.216 |
2.180 |
2.145 |
2.141 |
2.093 |
|
ID I(1 → 12)1____________ |
0.115 |
0.097 |
0.078 |
0.081 |
0.067 |
0.087 |
|
ID 1(1 → 12)2____________ |
0.749 |
0.762 |
0.774 |
0.778 |
0.790 |
0.770 |
|
Mp |
2.944 |
2.909 |
2.817 |
2.756 |
2.711 |
2.718 |
Source: Portuguese accounting multiplier matrices (Ma) from 1995 to 2000.
- 18 -
More intriguing information
1. Migration and employment status during the turbulent nineties in Sweden2. AGRICULTURAL TRADE LIBERALIZATION UNDER NAFTA: REPORTING ON THE REPORT CARD
3. Barriers and Limitations in the Development of Industrial Innovation in the Region
4. WP RR 17 - Industrial relations in the transport sector in the Netherlands
5. THE MEXICAN HOG INDUSTRY: MOVING BEYOND 2003
6. The name is absent
7. The name is absent
8. The name is absent
9. The name is absent
10. The name is absent