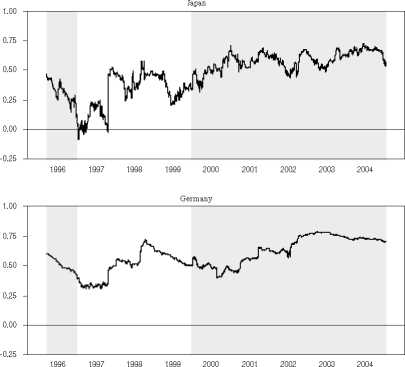
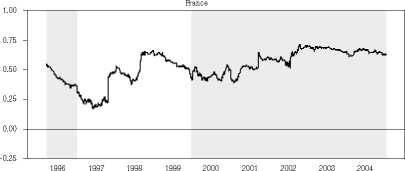
Figure 3. Dynamic Conditional Correlation between SPDR and iShares returns
1.00
0.75
0.50
0.25
0.00
-0.25
1.00
0.75
0.50
0.25
0.00
-0.25
UK
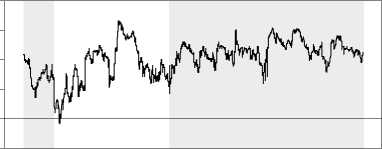
1996 1997 1998 1999 2000 2001 2002 2003 2004
Canada
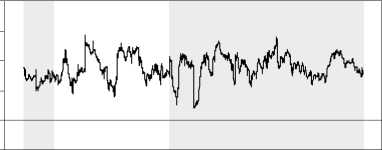
1996 1997 1998 1999 2000 2001 2002 2003 2004
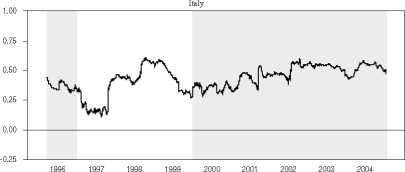
Notes. The figure shows conditional correlation coefficients between between SPDR and respective iShares,
extracted from the DCC-GARCH(1,1) specification of the DCC-GARCH model of Engle (2002), with t-distributed
errors. see section 5.3. for the details of the model.
32
More intriguing information
1. The name is absent2. Policy Formulation, Implementation and Feedback in EU Merger Control
3. Micro-strategies of Contextualization Cross-national Transfer of Socially Responsible Investment
4. Großhandel: Steigende Umsätze und schwungvolle Investitionsdynamik
5. The name is absent
6. The name is absent
7. The name is absent
8. The name is absent
9. The Values and Character Dispositions of 14-16 Year Olds in the Hodge Hill Constituency
10. I nnovative Surgical Technique in the Management of Vallecular Cyst