Figure 3: Type of alcohol drunk by cohort and gender
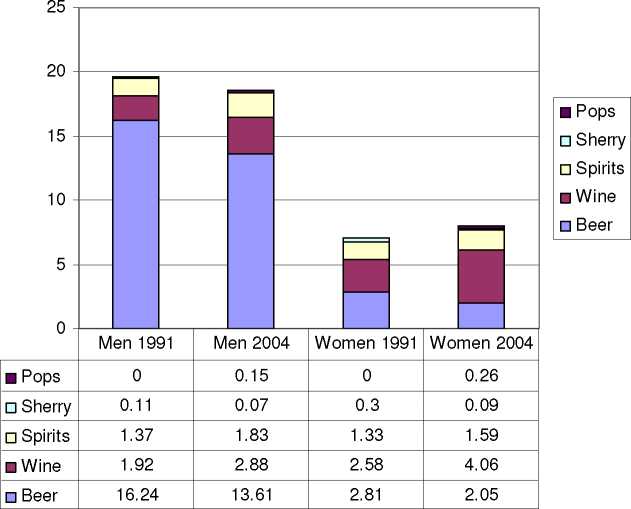
Figure 4 illustrates the social class differences in the types of alcohol drunk by
individuals in the 1958 and 1970 cohorts. It can be seen that for both the 1958 and
the 1970 cohorts, men in non-manual occupations report that they drink
approximately twice as much wine as men in manual occupations. However, beer still
accounts for the majority of units of alcohol reported by men. It is also clear that the
increase in alcohol consumption between the cohort born in 1970 and the cohort
born in 1958 is most marked for women in non-manual occupations and that this is
linked to a dramatic increase in the number of units of wine that women report they
consumed in the previous week - from an average of 2.85 for non-manual women in
the 1958 cohort to 4.55 for non-manual women in the 1970 cohort.
It can also be seen from Figure 4 that the mean quantity of ‘alcopops’ drunk by
cohort members in 2004 is very low. This means that including this new category of
alcoholic drink in the 2004 survey is unlikely to have a major impact on the measure
of total alcohol consumed in the previous week.
13
More intriguing information
1. Towards a framework for critical citizenship education2. Effort and Performance in Public-Policy Contests
3. Are Japanese bureaucrats politically stronger than farmers?: The political economy of Japan's rice set-aside program
4. Performance - Complexity Comparison of Receivers for a LTE MIMO–OFDM System
5. Examining the Regional Aspect of Foreign Direct Investment to Developing Countries
6. Concerns for Equity and the Optimal Co-Payments for Publicly Provided Health Care
7. The Effects of Reforming the Chinese Dual-Track Price System
8. The name is absent
9. Studying How E-Markets Evaluation Can Enhance Trust in Virtual Business Communities
10. The name is absent