In contrast to the producer service sector, the manufacturing sector is easily identified.
A list of these will not be provided. The industries classified into the manufacturing
sector are those with a SIC code within the interval 15-37 at the 2-digit level.
3.2 The spatial distribution of manufacturing & producer
services across Swedish functional regions
Figure 3.1. shows how the spatial distribution of the employment in manufacturing
and producer service sector across Swedish functional regions in 2000. It is evident that
the manufacturing sector is less concentrated to large urban regions than the producer
service sector. The three largest regions 10, in population terms, had approximately 58 %
of the total employment in the producer service sector while the same regions accounted
for about 30 % of the total manufacturing employment.
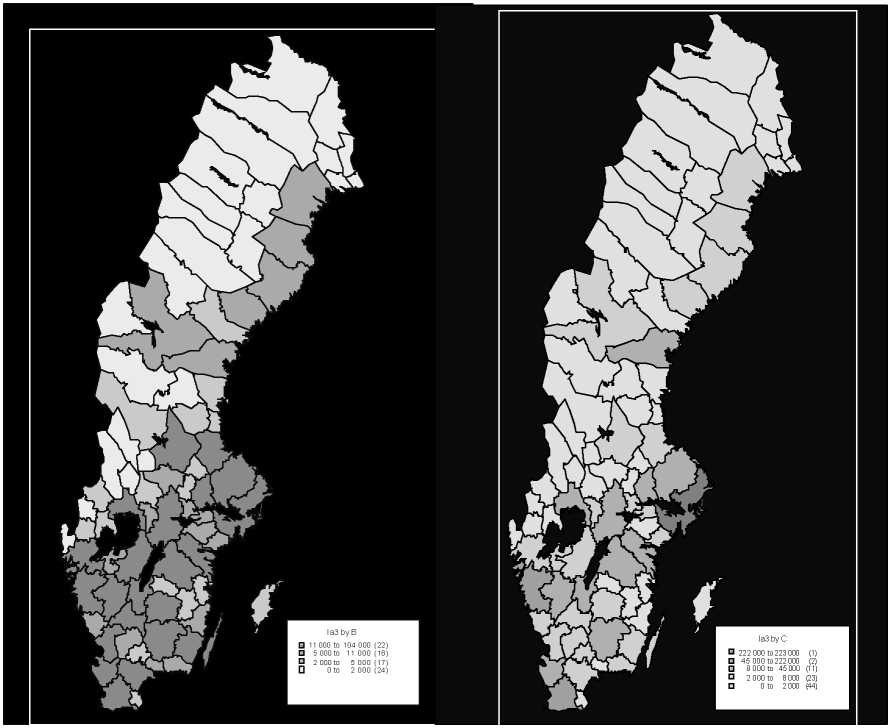
Figure 3.1. The geographical distribution of manufacturing (left) and producer service (right)
employment across the 81 functional regions in Sweden 2000.
The Stockholm region stands out when it comes to the producer service sector. By
itself, it accounted for no less than 37 % of the total employment in this sector. The same
figure for manufacturing amounted to 14 %. This can be seen as an indication of that
10 These are, in descending order, Stockholm, Gothenbourg and Malmoe.
10
More intriguing information
1. Measuring and Testing Advertising-Induced Rotation in the Demand Curve2. The name is absent
3. The name is absent
4. Altruism with Social Roots: An Emerging Literature
5. Pricing American-style Derivatives under the Heston Model Dynamics: A Fast Fourier Transformation in the Geske–Johnson Scheme
6. A Multimodal Framework for Computer Mediated Learning: The Reshaping of Curriculum Knowledge and Learning
7. The name is absent
8. Review of “From Political Economy to Economics: Method, the Social and Historical Evolution of Economic Theory”
9. THE ANDEAN PRICE BAND SYSTEM: EFFECTS ON PRICES, PROTECTION AND PRODUCER WELFARE
10. The name is absent