Appendix
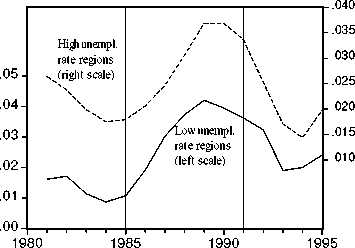
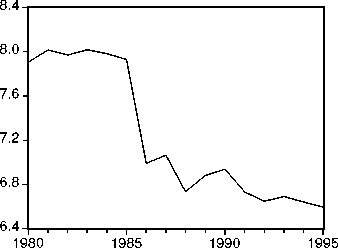
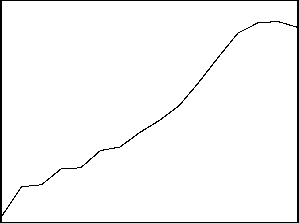
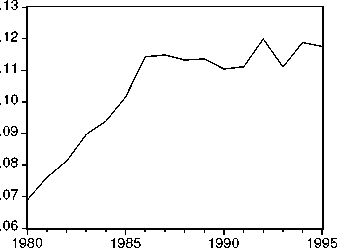
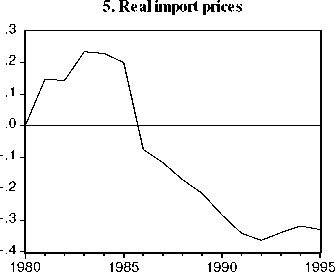
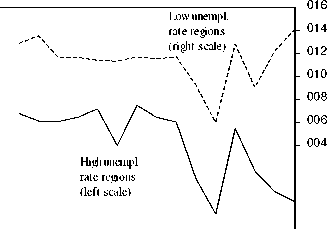
Figure A. Explanatory variables in the labour market model
1. Investment (growth rate of capital stock)
2. Real oil prices
12.9-
12.1
1980
3. Real social security benefits per person
12.8 -
12.7-
12.6-
12.5-
12.4-
12.3 -
12.2-
1985
1990
1995
4. Indirect taxes (as a % of GDP)
.016-
.014-
.012 -
.010-
.008-
.006-
.004-
6. Working Age Population Growth
1980 1985 1990 1995
30
More intriguing information
1. Three Strikes and You.re Out: Reply to Cooper and Willis2. FUTURE TRADE RESEARCH AREAS THAT MATTER TO DEVELOPING COUNTRY POLICYMAKERS
3. Work Rich, Time Poor? Time-Use of Women and Men in Ireland
4. The name is absent
5. Towards a framework for critical citizenship education
6. A Study of Prospective Ophthalmology Residents’ Career Perceptions
7. The name is absent
8. The name is absent
9. Valuing Access to our Public Lands: A Unique Public Good Pricing Experiment
10. Spatial Aggregation and Weather Risk Management