Figure 2 (B): A Survival function of Foreign-owned Plants in Ireland
1986-1996 by Scale of R&D Activity.
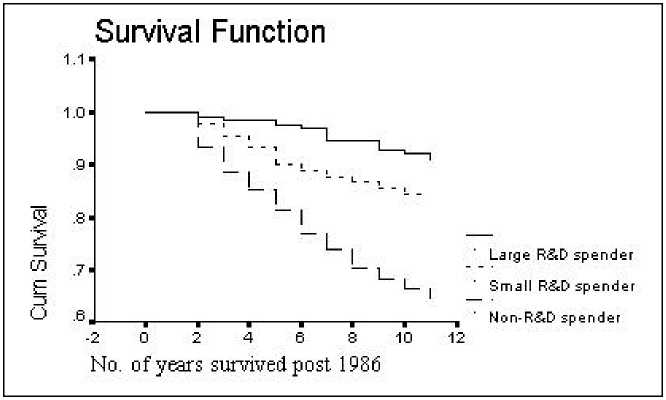
Source: Calculated using data from Forfas.
Appendix A
Table A1: Lifetable Analysis of Foreign-owned plants by Sector 1980-
1996
|
Sector (OECD) Probability of Staying: |
High- Tech_____ |
Medium- High-tech |
Medium- Low-tech |
Low-Tech |
All |
|
5 years |
74.52% |
73.59% |
71.38% |
65.32% |
70.36% |
|
10 years |
63.47% |
59.95% |
55.42% |
48.07% |
55.18% |
|
17 years (1980- 1996)_______ |
55.97% |
52.94% |
46.96% |
38.89% |
47.02% |
|
Source: Calculated using data from Forfas. | |||||
Table Note A1:Wilcoxon-Gehan statistics show that the difference in
probabilities of survival between plants in different sectors are
statistically significant at the 1% level.
Table A2: Lifetable Analysis of Foreign-owned plants by R&D
Activity 1986-1996
|
Scale of R&D spend Probability of Staying: |
non-R&D Spenders |
Total R&D Spenders_____ |
Small R&D _____Spenders |
Large R&D |
|
5 years |
76.79% |
93.55% |
88.89% |
96.85% |
|
10 years_______________ |
64.35% |
88.02% |
84.44% |
90.55% |
Source: Calculated using data from Forfas.
35
More intriguing information
1. The name is absent2. The name is absent
3. Financial Markets and International Risk Sharing
4. Voluntary Teaming and Effort
5. A Critical Examination of the Beliefs about Learning a Foreign Language at Primary School
6. Are Public Investment Efficient in Creating Capital Stocks in Developing Countries?
7. Regulation of the Electricity Industry in Bolivia: Its Impact on Access to the Poor, Prices and Quality
8. The name is absent
9. CONSUMER ACCEPTANCE OF GENETICALLY MODIFIED FOODS
10. Fiscal Sustainability Across Government Tiers