X2 = 190.4, df = 7, p<.0000; P2: X2 = 158.2, df = 7, p<.0000; P3: X2 = 276.5, df = 7,
p<.0000). In addition separate Wilcoxon between tasks were carried out. The significant
differences between tasks for post test 1 are presented on Diagram 7.11.
Diagram 7.11 Pattern of success across tasks during post test 1
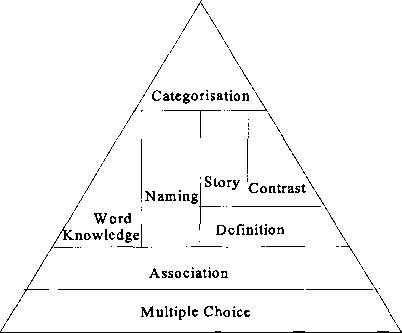
As the above diagram shows, during post test 1 the children performed significantly better
on the multiple choice than all the other tasks. They performed significantly better on the
association task than the other tasks. In addition they performed significantly better on the
definition than the contrast, story generation and short questions (categorisation questions).
They performed significantly better on the short questions (world knowledge) naming,
contrast and story generation task than the short questions (categorisation questions) (see
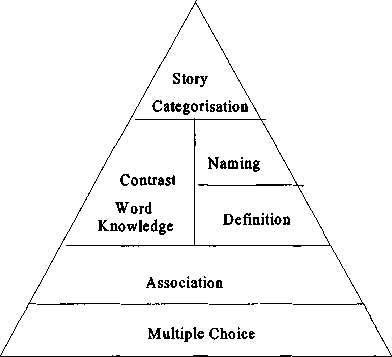
Table in Appendix 7.13 for the statistical comparisons). The following diagram presents
children’s success on the tasks during post test 2.
Diagram 7.12 Pattern of success across tasks during post test 2
288
More intriguing information
1. Strategic Policy Options to Improve Irrigation Water Allocation Efficiency: Analysis on Egypt and Morocco2. Can we design a market for competitive health insurance? CHERE Discussion Paper No 53
3. Learning-by-Exporting? Firm-Level Evidence for UK Manufacturing and Services Sectors
4. Motivations, Values and Emotions: Three Sides of the same Coin
5. Three Policies to Improve Productivity Growth in Canada
6. Impacts of Tourism and Fiscal Expenditure on Remote Islands in Japan: A Panel Data Analysis
7. The name is absent
8. The Demand for Specialty-Crop Insurance: Adverse Selection and Moral Hazard
9. Party Groups and Policy Positions in the European Parliament
10. Activation of s28-dependent transcription in Escherichia coli by the cyclic AMP receptor protein requires an unusual promoter organization