telecommunication flow matrix (tjj j, a (32, 32)-distance matrix (dij j, and gross
regional products for the 32 telecommunication regions - a set of 992 3-tupel
(sj,dij,tjj) with i, j = 1,...,32 (i ≠ j) was constructed. The first two components
represent the input variables x2j_1 and x2j of the j-th module of the network model
1CSL (x, w), and the last component the target output. The bias term bi^ is clamped to
the scalar 1/ ti.. sj represents the potential draw of telecommunication in j and is
measured in terms of the gross regional product, dij in terms of distances from i to j,
while tjj and ti. represent telecommunication traffic flows. The input data were
preprocessed to data scaled into [0.1, 0.9]10.
The telecommunication data used stem from network measurements of carried traffic in
Austria in 1991, in terms of erlang, an internationally widely used measure of
telecommunication contact intensity, which is defined as the number of phone calls
(including facsimile transfers) multiplied by the average length of the call (transfer)
divided by the duration of measurement11 [for more details, see Fischer and Gopal
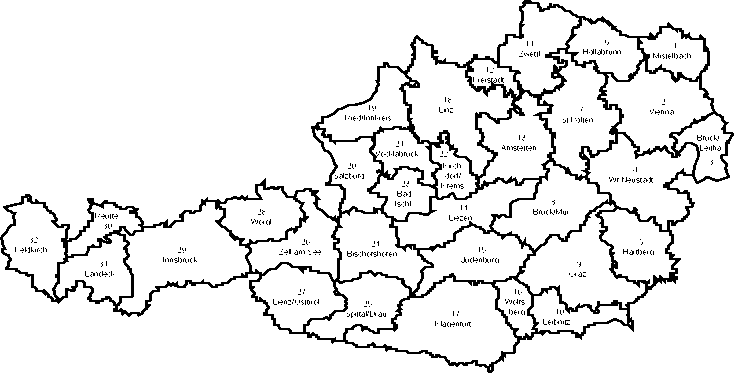
1994]. The data refer to the telecommunication traffic between the 32
telecommunication districts representing the second level of the hierarchical structure
of the Austrian telecommunication network (see Figure 2). Due to measurement
problems, intraregional traffic (i.e. i = j) is left out of consideration.
Hollabrunn
Mistelbach
Vienna
StPnlten
21
22
WrNeustad
Bruck/Mur
Wnrg
Hartberg
Judenburg
Spittal/Drau
Klagenfur
Bruck/
Leitha
23
Bad
sch
18
Linz
Kirch
dorf/
Krems
Reutte
30
20
alzburg
16
Wolfs
berg
14
Lieze
10
Leibnitz
31
Landeck
32
Feldkirch
29
nnsbruck
13
Amstetten
26
Zell am See
27
Lienz/Osttiro
19
Ried/Innkreis
24
Bischofshofen
Figure 2: The Regional System for Modelling Interregional Telecommunciation
Traffic in Austria
One of the simplest methods for estimating the prediction error is data splitting. This
method simulates model validation with new data by partitioning the total data set of
22
More intriguing information
1. The name is absent2. The demand for urban transport: An application of discrete choice model for Cadiz
3. News Not Noise: Socially Aware Information Filtering
4. The name is absent
5. Visual Artists Between Cultural Demand and Economic Subsistence. Empirical Findings From Berlin.
6. Spatial agglomeration and business groups: new evidence from Italian industrial districts
7. Crime as a Social Cost of Poverty and Inequality: A Review Focusing on Developing Countries
8. Towards Teaching a Robot to Count Objects
9. Firm Creation, Firm Evolution and Clusters in Chile’s Dynamic Wine Sector: Evidence from the Colchagua and Casablanca Regions
10. The name is absent