ANNEX 2
Table A.2.1. Comparison at a national level between the proposed indicator and the long-run
response of output in front of a monetary shock obtained by Carlino and DeFina (1998)
|
% Manufacturing |
% Building |
Average firm size |
Indicator |
Carlino-DeFina | |
|
Spain |
20,80 |
784 |
13,79 |
47,57 |
2,05 |
|
France |
20,92 |
5,47 |
72,72 |
-13,60 |
1,42 |
|
Netherlands |
18,55 |
5,48 |
94,16 |
-37,41 |
1,42 |
|
Ireland |
29,88 |
5,52 |
44,71 |
23,41 |
2,20 |
|
Italy |
23,98 |
5,97 |
82,64 Tst -τ; md m ... .ʌ. ɪʌ |
-19,97 |
1,43 |
Source: Own elaboration from Eurostat-Regio (1st and 2nd column); DAISIE Annual industrial survey (NEW
CRONOS) (3rd column) and Carlino and DeFina (1998).
ANNEX 3
Figure A.3.1. Evolution of main macroeconomic variables in Spain from 1985 to 1992 (annual
growth rates, except for interest rates -R-)
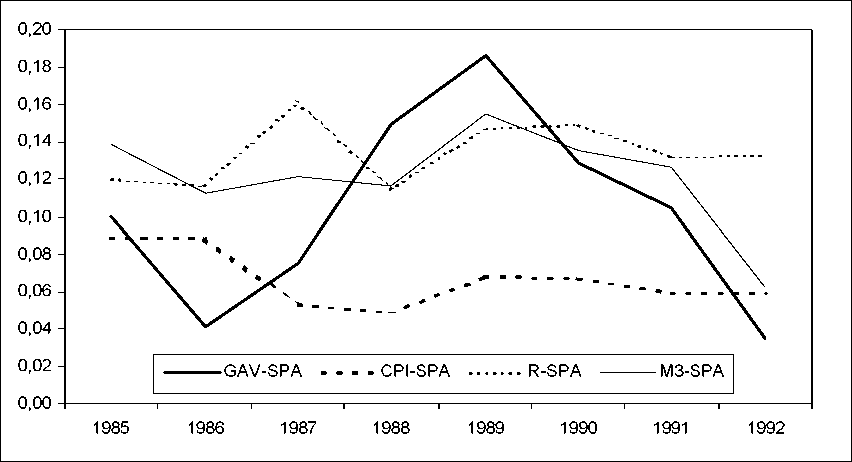
Source: Eurostat (GAV) and INE (Consumer Prices Index, Interest Rates and M3).
22
More intriguing information
1. Does adult education at upper secondary level influence annual wage earnings?2. Transport system as an element of sustainable economic growth in the tourist region
3. The name is absent
4. Higher education funding reforms in England: the distributional effects and the shifting balance of costs
5. The name is absent
6. Income Taxation when Markets are Incomplete
7. Happiness in Eastern Europe
8. The Role of Immigration in Sustaining the Social Security System: A Political Economy Approach
9. The name is absent
10. Wirkt eine Preisregulierung nur auf den Preis?: Anmerkungen zu den Wirkungen einer Preisregulierung auf das Werbevolumen