locational self-preference has increased in the Netherlands during the period under
consideration.
The starting value of the function, representing the rating of the firm’s own location, has
increased for instance. At the same time, the end value, representing the rating of distant
places, has decreased (Figure 3, Table 1). In other words, the difference between the
rating of nearby and that of distant places has become larger. Function coefficient a
expresses the difference between the starting value and the end value of the curve.
Calculated on a collective basis, it increased from 2.49 in 1983 to 2.93 in 2003 (Table
1). Worth mentioning is also the turning point, defined as the distance for which a
neutral rating is predicted. It has come closer to the firm’s location, which is another
indication of an increasing degree of locational self-preference.
Figure 3 Rating of locations and distance
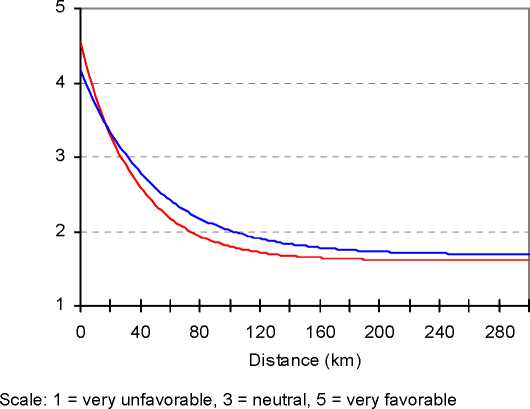
1983
--- 2003
Table 1 Coefficients and indicators of the modified exponential
|
1983 |
1993 |
2003 | |
|
k |
1.686 |
1.697 |
1.607 |
|
a |
2.489 |
2.646 |
2.931 |
|
b |
0.980 |
0.977 |
0.973 |
|
Starting value* (d=0) |
4.17 |
4.34 |
4.54 |
|
End value* (d=oo) |
1.69 |
1.70 |
1.61 |
|
Turning point (km) |
31 |
31 |
27 |
* Scale: 1 = very unfavorable, 3 = neutral, 5 = very favorable
More intriguing information
1. Wage mobility, Job mobility and Spatial mobility in the Portuguese economy2. Optimal Tax Policy when Firms are Internationally Mobile
3. International Financial Integration*
4. Measuring and Testing Advertising-Induced Rotation in the Demand Curve
5. AN ECONOMIC EVALUATION OF THE COLORADO RIVER BASIN SALINITY CONTROL PROGRAM
6. Imperfect competition and congestion in the City
7. The name is absent
8. Text of a letter
9. The name is absent
10. Should Local Public Employment Services be Merged with the Local Social Benefit Administrations?