than 5% of GDP in 1986 was turned into a surplus of 4% in 1993 (figure 2). To which extend
was this accomplished by removing productive resources (labour) from the domestic sector
to the trade sector of the Danish economy?
Last but not least wage inequality in Denmark is smaller than in most other countries. The
wage-return to education is low: 0-6 percent per year of completed formal education (Hansen
1993, Westergaard-Nielsen 1996, Belzil & Hansen 1997) compared to 8-10 percent in UK and
USA (Stewart 1996, Ashenfelter & Rouse 1998). Moreover inequality in Denmark did not
increase from in the 1980s (Hummelgaard & Husted 1994, Pedersen & Smith 1997).
Abbildung 1 GDP per capita 1980, 1986
and 1994. Denmark, Germany and USA
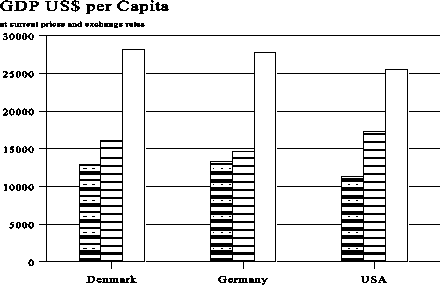
= 1980 H 1986 I I 1994
Abbildung 2 Current account
balance 1978-1995. Denmark and
OECD Europe.
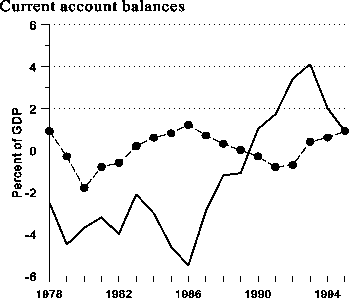
------ Denmark
—*— OECD Europe
International it seems generally accepted stylized facts that:
1. The demand for low skilled labour are falling in the North (affluent EU-countries, USA etc.)
2. Real wages for low skill workers are declining in countries with free labour markets (like
USA and UK) and unemployment are rising in countries with more negotiated wage setting
(BRD and Denmark).
This paper explores to which extend these facts and the explanation behind them can be found
in the Danish case.
More intriguing information
1. The name is absent2. Does adult education at upper secondary level influence annual wage earnings?
3. The Context of Sense and Sensibility
4. News Not Noise: Socially Aware Information Filtering
5. Stable Distributions
6. Licensing Schemes in Endogenous Entry
7. How to do things without words: Infants, utterance-activity and distributed cognition.
8. The name is absent
9. A Computational Model of Children's Semantic Memory
10. The name is absent