Figure 3: Empirical distribution of average cooperation by economy(*)
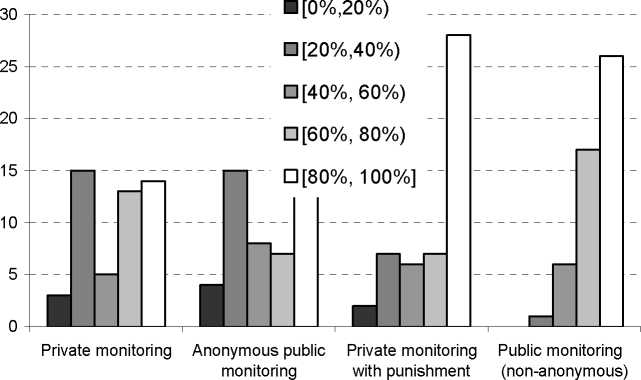
(**)
Table 4: Cooperation in the first period of an economy
|
Number of |
Private |
Anonymous |
Private monitoring |
Public monitoring |
|
Average cooperation | ||||
|
73.5% |
70.5% |
84.5% |
87.0% | |
|
Frequency of cooperation in an economy | ||||
|
4 |
36% |
26% |
50% |
54% |
|
3 |
30% |
42% |
38% |
40% |
|
2 |
28% |
22% |
12% |
6% |
|
1 |
4% |
8% |
0% |
0% |
|
0 |
2% |
2% |
0% |
0% |
|
Frequency of cooperation in a match | ||||
|
2 |
58% |
51% |
71% |
75% |
|
1 |
31% |
39% |
27% |
24% |
|
0 |
11% |
10% |
______2%______ |
_______1%______ |
(*) Kolmogorov-Smirnov two-tail two-sample test on distributions confirms results from the Mann-Whitney
tests on the differences between averages. On one hand private monitoring and anonymous public
monitoring are not statistically different (10% confidence level, n1=n2=50). Conversely, private monitoring
with punishment and non-anonymous public monitoring are not statistically different. Treatments from the
two groups are instead statistically different at least at a 5% level.
(**) In each treatment the number of observations is 50 for “average” and “frequency of cooperation in an
economy” and 100 for “frequency of cooperation in a match.”
19
More intriguing information
1. Implementation of a 3GPP LTE Turbo Decoder Accelerator on GPU2. Optimal Taxation of Capital Income in Models with Endogenous Fertility
3. Modelling the Effects of Public Support to Small Firms in the UK - Paradise Gained?
4. The name is absent
5. The name is absent
6. Fighting windmills? EU industrial interests and global climate negotiations
7. Skills, Partnerships and Tenancy in Sri Lankan Rice Farms
8. The Veblen-Gerschenkron Effect of FDI in Mezzogiorno and East Germany
9. Do imputed education histories provide satisfactory results in fertility analysis in the Western German context?
10. Proceedings from the ECFIN Workshop "The budgetary implications of structural reforms" - Brussels, 2 December 2005