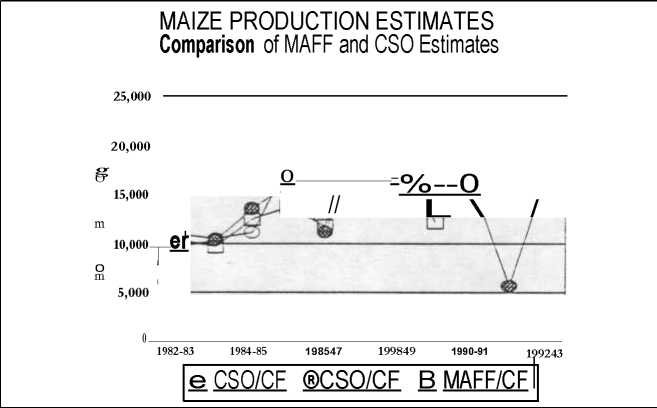
Figure 8.1: Comparison of the CSO and MAFF maize estimates
TOTAL AREA PLANTED TO MAIZE
Comparison of MAFF and CSO Estimates
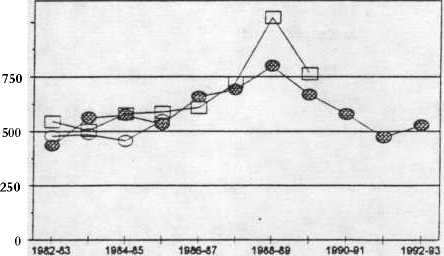
je CSO/AS ® CSO/CF MAFF/CF
16,000
MAIZE SALES ESTIMATES
Comparison of MAFF and CSO Estimates
10,000

1982-83 1984-85 1986-87 1988-89 1990-91 1992-93
0
e cso/AS e>~ cso/cf b maff/cf
More intriguing information
1. Enterpreneurship and problems of specialists training in Ukraine2. Julkinen T&K-rahoitus ja sen vaikutus yrityksiin - Analyysi metalli- ja elektroniikkateollisuudesta
3. The name is absent
4. EXECUTIVE SUMMARY
5. The Works of the Right Honourable Edmund Burke
6. CROSS-COMMODITY PERSPECTIVE ON CONTRACTING: EVIDENCE FROM MISSISSIPPI
7. Deprivation Analysis in Declining Inner City Residential Areas: A Case Study From Izmir, Turkey.
8. New urban settlements in Belarus: some trends and changes
9. HACCP AND MEAT AND POULTRY INSPECTION
10. Equity Markets and Economic Development: What Do We Know