Figure 6: Development of MED’s exports to the EU and preferential quota for oranges
Morocco

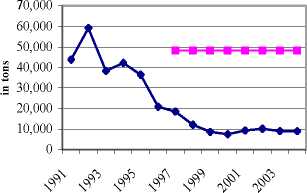
Cyprus
• Exports
■ Quota
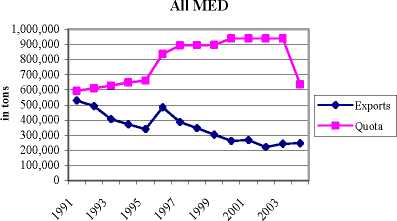
Table 5: Orange quota filling rates (orange exports in % of quota)
|
1991 |
1992 |
1993 |
1994 |
1995 |
1996 |
1997 |
1998 |
1999 |
2000 |
2001 |
2002 |
2003 |
2004 | |
|
Morocco |
132 |
106 |
91 |
86 |
59 |
54 |
39 |
35 |
33 |
26 |
26 |
21 |
25 |
46 |
|
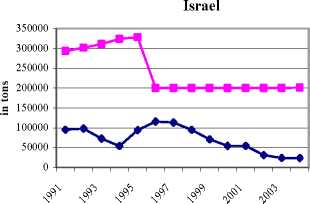
Israel |
32 |
33 |
23 |
17 |
28 |
58 |
57 |
47 |
35 |
27 |
27 |
15 |
12 |
12 |
|
Cyprus |
- |
- |
- |
- |
- |
- |
38 |
25 |
18 |
16 |
19 |
21 |
19 |
19 |
|
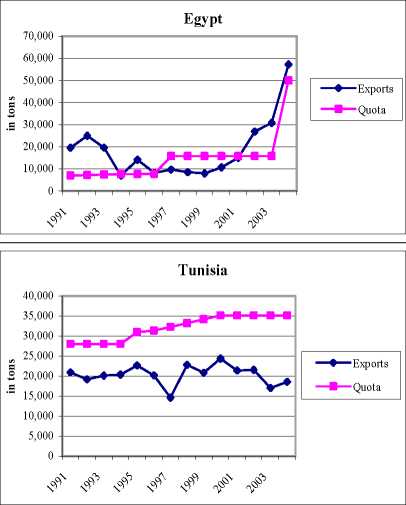
Egypt |
279 |
347 |
264 |
92 |
184 |
105 |
61 |
54 |
50 |
68 |
95 |
170 |
195 |
114 |
|
Tunisia |
75 |
69 |
72 |
73 |
73 |
64 |
45 |
69 |
61 |
69 |
61 |
61 |
48 |
53 |
|
Average |
130 |
139 |
113 |
67 |
86 |
70 |
48 |
46 |
39 |
41 |
46 |
58 |
60 |
49 |
Sources: Eurostat (various issues), European Union (various issues), own calculations.
The corresponding quota filling rates, equal to the orange exports in percentage of the total
orange quota, are given in Table 5. Morocco’s and Egypt’s orange exports actually exceed
their quotas in some years during the 1990s, but fall below afterwards. Morocco’s filling rate
has been under 50% since 1997. The removal of the TRQ in 2004 caused an increase of the
filling rate in that year. Egypt exceeds its quota in 2002 to 2004 due to the rise of Egyptian
12
More intriguing information
1. The name is absent2. Multiple Arrhythmogenic Substrate for Tachycardia in a
3. Happiness in Eastern Europe
4. Volunteering and the Strategic Value of Ignorance
5. The Economics of Uncovered Interest Parity Condition for Emerging Markets: A Survey
6. Evaluating the Impact of Health Programmes
7. The name is absent
8. A simple enquiry on heterogeneous lending rates and lending behaviour
9. Measuring and Testing Advertising-Induced Rotation in the Demand Curve
10. Commuting in multinodal urban systems: An empirical comparison of three alternative models