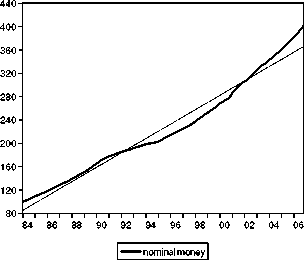
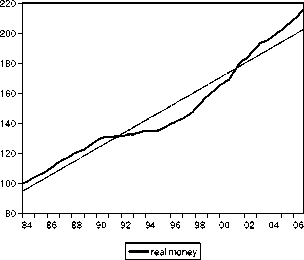
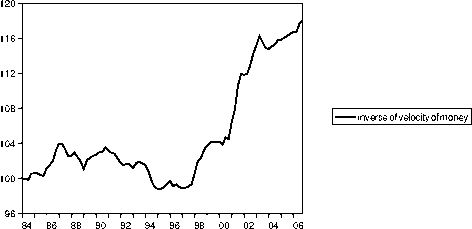
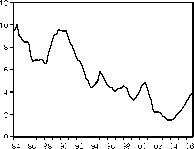
Figure 1: Development in global liquidity since 1984
HPI
.06
.05
.04
.03
.02
.01
.00 ......................
84 86 88 90 92 94 96 98 00 02 04 06
IS
.06
.05
.04
.03
.02
.01
.00.......................
84 86 88 90 92 94 96 98 00 02 04 06
M
.12
.10
.08
.06
.04
.02
84 86 88 90 92 94 96 98 00 02 04 06
:tz
0Azn
.............»..............
84 86 88 90 92 94 96 98 00 02 04 06
MSW
.6
.4
.2
.0
-.2
-.4 ......................
84 86 88 90 92 94 96 98 00 02 04 06
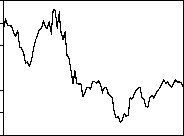
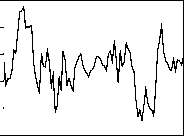
Figure 2: Global series, 4-quarter moving average of growth rates (except interest
rate series), 1984Q1 - 2006Q4
13
More intriguing information
1. The name is absent2. The name is absent
3. The name is absent
4. Willingness-to-Pay for Energy Conservation and Free-Ridership on Subsidization – Evidence from Germany
5. Towards Learning Affective Body Gesture
6. An Efficient Circulant MIMO Equalizer for CDMA Downlink: Algorithm and VLSI Architecture
7. Special and Differential Treatment in the WTO Agricultural Negotiations
8. Nonparametric cointegration analysis
9. Evidence of coevolution in multi-objective evolutionary algorithms
10. Parallel and overlapping Human Immunodeficiency Virus, Hepatitis B and C virus Infections among pregnant women in the Federal Capital Territory, Abuja, Nigeria