Design Matrix example for Paired t-test.
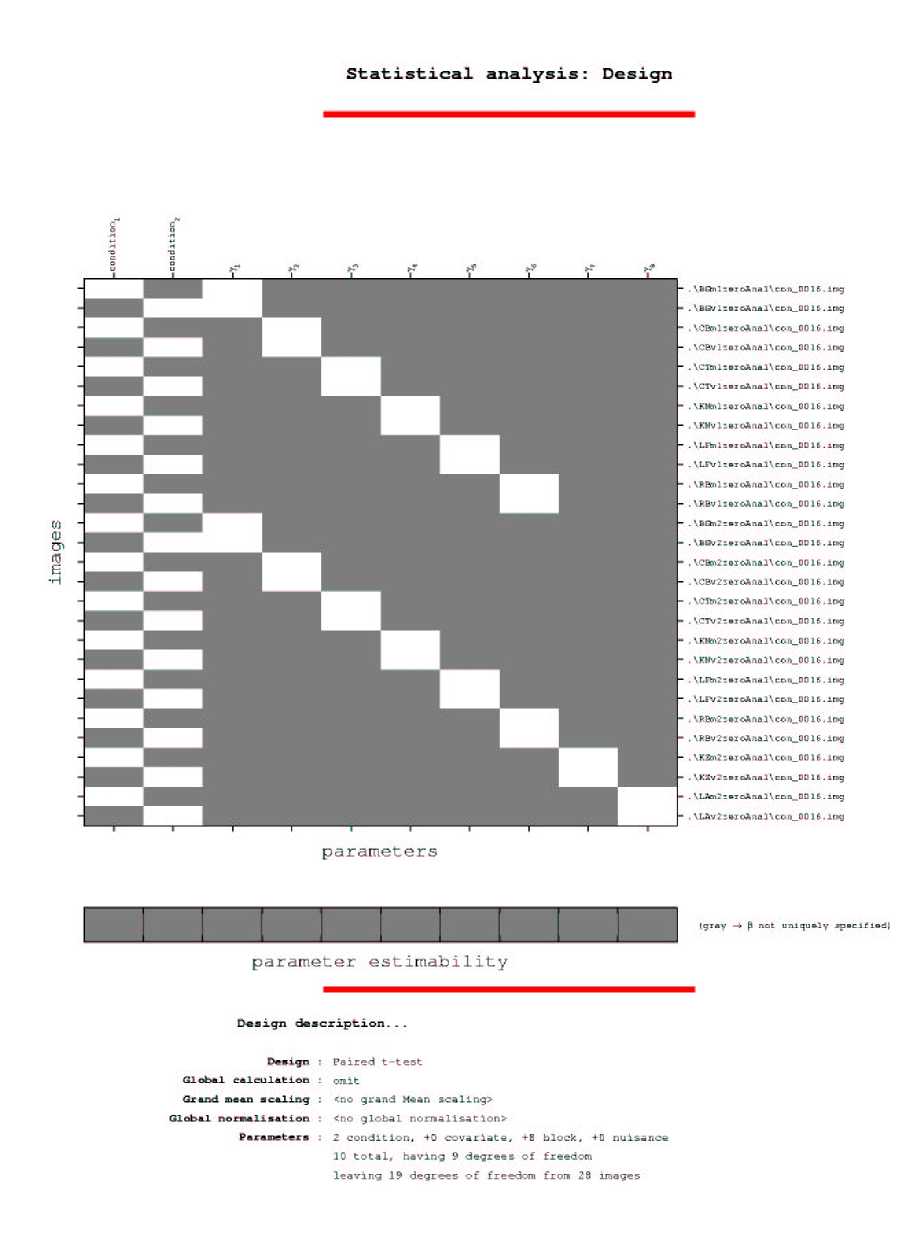
Figure S3: Group data analysis of fMRI data followed a random effects model
as implemented in the SPM99 software. We performed paired t-test between
sequence conditions two at a time and allowed for within and between subject
variances to be different.
It was observed that the activations in main effects of sequence compared to
follow in the early and late stages had very large clusters comprising few
34
More intriguing information
1. Growth and Technological Leadership in US Industries: A Spatial Econometric Analysis at the State Level, 1963-19972. TOWARD CULTURAL ONCOLOGY: THE EVOLUTIONARY INFORMATION DYNAMICS OF CANCER
3. How Offshoring Can Affect the Industries’ Skill Composition
4. The Dynamic Cost of the Draft
5. The name is absent
6. The value-added of primary schools: what is it really measuring?
7. Natural Resources: Curse or Blessing?
8. Group cooperation, inclusion and disaffected pupils: some responses to informal learning in the music classroom
9. EXECUTIVE SUMMARY
10. CURRENT CHALLENGES FOR AGRICULTURAL POLICY