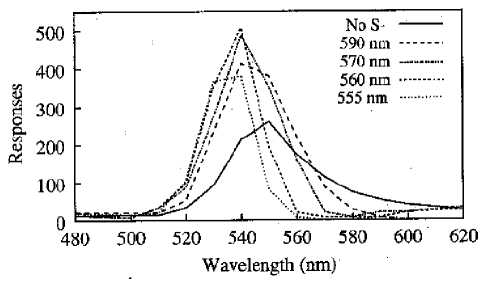
Figure 6: Gradients obtained in a light-wavelength generalization test with pigeons, repro-
duced from Hanson (1959). The lower gradient is a control one, obtained after training
on a 560-nm wavelength. The other gradients result from discrimination training between
the 560-nm light and other colours, as indicated in the legend.
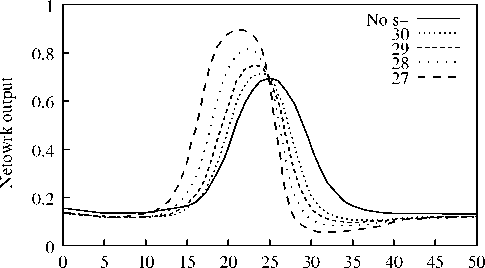
Stimulus location
Figure 7: Network generalization gradients coming from the translation test. The s+ was
fixed, and four different negative stimuli were used, consisitng in a ‘signal’ like that in
s+ (see figure 2), but with a displaced position (indicated in the legend above). The evo-
lutionary algorithm gave entirely similar results, but for clarity only data from networks
trained with the back-propagation algorithm are shown. The input layer of the networks
was made of fifty units, and the positive stimulus was centered at position 30 (with a tar-
get output of 0.7) for the no-s- group and all discrimination groups. The negative stimuli
(target output 0.2) were centered at the positions indicated in the legend.
10
More intriguing information
1. The Impact of Minimum Wages on Wage Inequality and Employment in the Formal and Informal Sector in Costa Rica2. Consumer Networks and Firm Reputation: A First Experimental Investigation
3. MANAGEMENT PRACTICES ON VIRGINIA DAIRY FARMS
4. An Estimated DSGE Model of the Indian Economy.
5. BUSINESS SUCCESS: WHAT FACTORS REALLY MATTER?
6. The quick and the dead: when reaction beats intention
7. The name is absent
8. Skill and work experience in the European knowledge economy
9. DIVERSITY OF RURAL PLACES - TEXAS
10. The name is absent