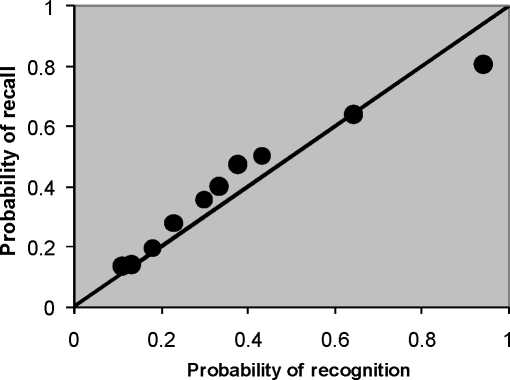
Figure 8.
the x=y function.
Probability of recognition and recall for the same delay times in (4). The line is
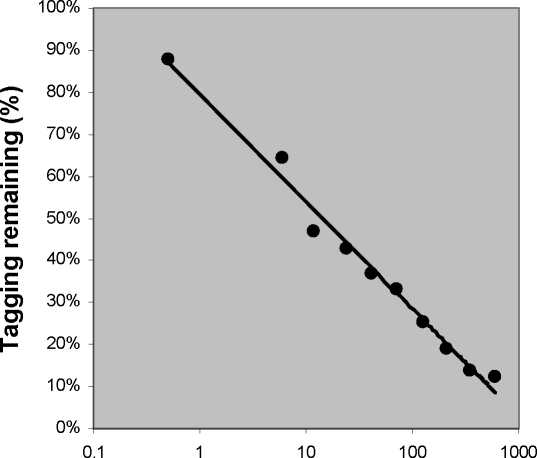
Time t after stimulus (seconds)
Figure 9. Tagging remaining averaged over recall and recognition memory items from (4).
The curve represents a two parameter logarithmic fit, moving t=0 seconds to t=0.5 seconds to
avoid a divergence.
More intriguing information
1. The name is absent2. The name is absent
3. Climate change, mitigation and adaptation: the case of the Murray–Darling Basin in Australia
4. Empirical Calibration of a Least-Cost Conservation Reserve Program
5. Subduing High Inflation in Romania. How to Better Monetary and Exchange Rate Mechanisms?
6. Valuing Access to our Public Lands: A Unique Public Good Pricing Experiment
7. Input-Output Analysis, Linear Programming and Modified Multipliers
8. The role of statin drugs in combating cardiovascular diseases
9. Cryothermal Energy Ablation Of Cardiac Arrhythmias 2005: State Of The Art
10. The name is absent