106
Results and Discussion ,
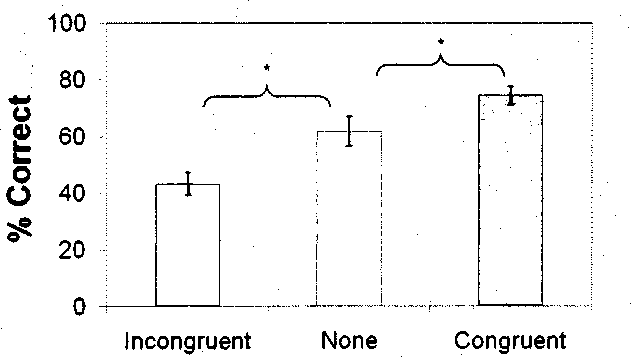
When the sound was the same frequency as the touch, tactile discrimination
performance increased by 12.8%, and when the sound was the opposite frequency as
the touch, tactile discrimination performance decreased by 18.8% in comparison to the
no sound condition (see Figure 3 and Table 1). A two-way ANOVA with auditory
stimulus (none, same frequency, different frequency) and Vibrotactile frequency (100
Hz, 200 Hz) as the two within subject factors revealed a highly significant main effect of
sound (Fbl8 = 21.008, p < 0.001). This main effect was driven both by an increase in
discrimination performance with congruent sounds as compared to the no sound
conditions (t18 = 3.010, p < 0.001) and a decrease in performance with incongruent
sounds as compared to the no sound conditions (he = 4.442, p < 0.001) . Themain
effect of Vibrotactile frequency (Fbl8 = ∙440, p = 0.516) and the sound x tactile
frequency interaction (Fbl8 = 1.434, p = 0.252) were not significant. These results
demonstrate a frequency-specific effect of sound Ontouchperception.
Frequency OfAuditory Stimulus
Figure 3. The data from Experiment 3 examining frequency-specific effects
of audition on touch. Error bars reflect ±1 standard error of the mean.
More intriguing information
1. Work Rich, Time Poor? Time-Use of Women and Men in Ireland2. The name is absent
3. Are Public Investment Efficient in Creating Capital Stocks in Developing Countries?
4. Asymmetric transfer of the dynamic motion aftereffect between first- and second-order cues and among different second-order cues
5. THE AUTONOMOUS SYSTEMS LABORATORY
6. ISSUES IN NONMARKET VALUATION AND POLICY APPLICATION: A RETROSPECTIVE GLANCE
7. Effects of red light and loud noise on the rate at which monkeys sample the sensory environment
8. DISCRIMINATORY APPROACH TO AUDITORY STIMULI IN GUINEA FOWL (NUMIDA MELEAGRIS) AFTER HYPERSTRIATAL∕HIPPOCAMP- AL BRAIN DAMAGE
9. Behavior-Based Early Language Development on a Humanoid Robot
10. The name is absent