137
that instead that capacitances of the Stim Project switching board coupled with large
voltage fluctuations at the time of switching are the cause (the voltage fluctuations are
more clearly illustrated in figure 5 of the next subsection, with the inclusion of unfiltered
recordings).
Time I ∙ ∙ , ∙ I ∙ 1 ' ’ 1 > 1 ∙ ∙ .......... ∣ > ɪ ∣ I ..............I ɪ ɪ ɪ ∣ I
(sec) 0.740 0.745 0.750 0.755 0.760
15∙3*∣
ch14_crf_Stim_Proj
-6.1 ∙
103*
ch14_of_neigh_elec
-1S.1
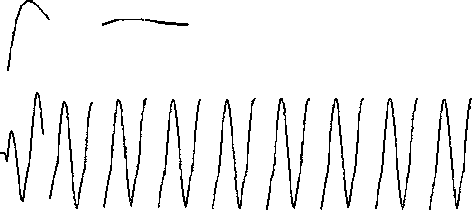
Fig. 2A At t=0.745s the stimulus is turned on, and is recorded by the neighboring
electrodes not connected throught the Stim Project.
⅛ 1 1 I 1 1 ......................I....... I . I I.....
(sec) 2.745 2.750 2.755 2.760 2765
15.3*∣
ch14-.of.Stim-Proj
ch14ofjre⅛h-elec
103*
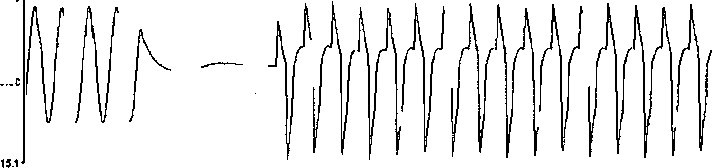
Fig. 2B Two seconds later the Stim Project is set to record and the stimulus waveform is
turned off. 5ms later a IkHz bipolar square wave with a 50% duty cycle is applied to
the saline medium. The Stim Project does not immediately register the waveform.
More intriguing information
1. Top-Down Mass Analysis of Protein Tyrosine Nitration: Comparison of Electron Capture Dissociation with “Slow-Heating” Tandem Mass Spectrometry Methods2. The name is absent
3. Confusion and Reinforcement Learning in Experimental Public Goods Games
4. PRIORITIES IN THE CHANGING WORLD OF AGRICULTURE
5. Tax systems and tax reforms in Europe: Rationale and open issue for more radical reforms
6. The Employment Impact of Differences in Dmand and Production
7. Life is an Adventure! An agent-based reconciliation of narrative and scientific worldviews
8. Kharaj and land proprietary right in the sixteenth century: An example of law and economics
9. The name is absent
10. A Note on Productivity Change in European Co-operative Banks: The Luenberger Indicator Approach