49
A. MR Scanner
—
0.00 0.50 1.00 1.50 2.00 2.50 tin
B. Strong Tactile ....................................
---------------------O'
C. Strong Auditory
D. Strong Tactile + Auditory
E. Weak Tactile

F. Weak Auditory
G. Weak Tactile + Auditory

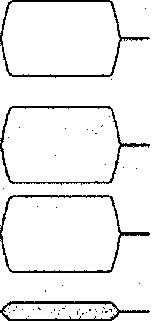
Figure 1. Structure of stimulation trials in Experiment 1. A. Clustered MRI acquisition protocol.
During the first 2 s of each 2.75-second trial, 33 images were acquired. Each image acquisition
(indicated with thick vertical bars) produced sound and vibration from the scanner. Experimental
stimuli were presented in the final 0.75 s of the trial, when no MR image acquisition occurred. B.
Sensory stimulus during strong tactile trials. Green line indicates tactile stimulation, red line
indicates auditory stimulation. The thick green portion indicates duration of a 200 Hz sinusoidal
Vibrotactile stimulus applied to the left hand. Gradual rise and fall of the thick green portion
reflects the 4 Hz sinusoidal envelope applied to the driving waveform. C. Sensory stimulus during
strong auditory trials. The thick red portion indicates duration of a 200 Hz sinusoid played in the
left ear. D. Sensory stimulus during strong tactile+auditory trials. Thick portions indicate
simultaneous tactile+auditory stimulus presentation. E. Unisensory tactile stimulus presented at
low intensity. F. Unisensory auditory stimulus presented at low intensity. G. Multisensory
tactile+auditory stimulus presented at low intensity.
More intriguing information
1. Mergers and the changing landscape of commercial banking (Part II)2. On s-additive robust representation of convex risk measures for unbounded financial positions in the presence of uncertainty about the market model
3. The name is absent
4. The name is absent
5. Applications of Evolutionary Economic Geography
6. Pursuit of Competitive Advantages for Entrepreneurship: Development of Enterprise as a Learning Organization. International and Russian Experience
7. The name is absent
8. Enterpreneurship and problems of specialists training in Ukraine
9. The resources and strategies that 10-11 year old boys use to construct masculinities in the school setting
10. Accurate and robust image superresolution by neural processing of local image representations