84
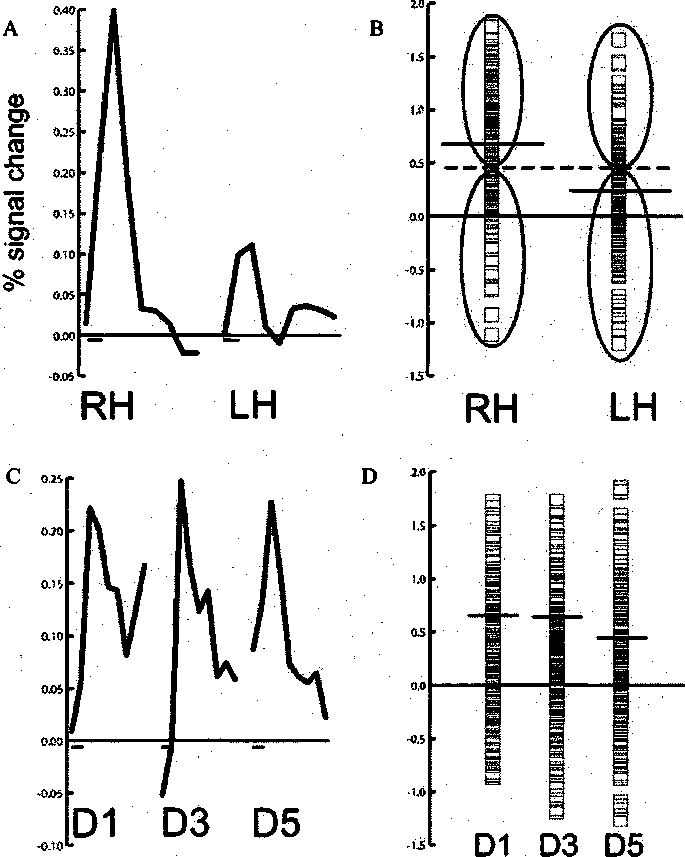
Figure 6. Classification performance with univariate analysis.
A. The solid blue line shows the BOLD response averaged across all trials to right hand (RH) and left
hand (LH) touch in the left hemisphere S2 of an individual subject in experiment 1. The duration of
each response is 16 seconds; the small black bar on the ×-a×is shows the stimulus duration of 2
seconds.
B. Each blue symbol show the BOLD response in a single trial of right hand (RH) touch (left column of
symbols) and left hand (LH) touch (right column) in left S2 (same subject as A). The solid black lines
show the mean response to RH and LH touch. The optimal classification boundary is midway between
the two means (dashed line). This boundary correctly classifies all RH trials above it and all LH trials
below it (66%, green ellipses) and incorrectly classifies all RH trials below it and all LH trials above it
(34%, red ellipses).
C. The BOLD response, averaged across all trials, to thumb (DI), middle finger (D3), and pinky finger
(D5) touch in the left hemisphere S2 of an individual subject in experiment 2.
D. Individual trial responses (blue squares) and means (black lines) in S2 to single finger touch.
More intriguing information
1. Strategic Policy Options to Improve Irrigation Water Allocation Efficiency: Analysis on Egypt and Morocco2. Comparative study of hatching rates of African catfish (Clarias gariepinus Burchell 1822) eggs on different substrates
3. Palvelujen vienti ja kansainvälistyminen
4. APPLICATIONS OF DUALITY THEORY TO AGRICULTURE
5. Secondary stress in Brazilian Portuguese: the interplay between production and perception studies
6. The demand for urban transport: An application of discrete choice model for Cadiz
7. Equity Markets and Economic Development: What Do We Know
8. Tax Increment Financing for Optimal Open Space Preservation: an Economic Inquiry
9. Linkages between research, scholarship and teaching in universities in China
10. The Composition of Government Spending and the Real Exchange Rate