(a)
зо
25
20
л
N
v 15
10
5
0
О 10 20 30 40 50 60 70
л
(Ь)
18 --------—I------------Г"-----:-----1-----------“1------------
• , •
16 - /
14 . / R2 = 0.979 .
12 - / -
* • /
м /
7 10 /. -
• /
S •/ -
6 - /• -
4 ■ / -
• -
2 ---------------«------------—I---------------1---------------1---------------
О 5 10 15 20 25
Nps
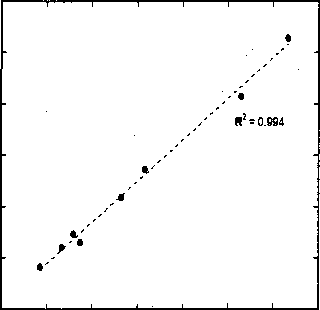
Figure 6.4: Scaling relation for the average brush height for attractive chains tethered to a
hard wall at different reduced temperatures, (a) < z > vs Ng pg at T* = 3 (theta solvent),
and (b) < z > vs Ngpg at T* = 2 (bad solvent), for Ng = 50, 100 and 200 at different
grafting densities. Symbols are the prediction from modified iSAFT and the dashed curves
are linear fit to this data.
Next, the attraction are added between the segments of the polymer brush to
study the effects of decreasing the quality of the (implicit) solvent. The quality of the
solvent is varied by changing the reduced temperature (T* = kT∕e). Reduced theta
temperature, Tg = 3.0, as shown by Grest and Murat [230]. They calculated this
value of the theta temperature by simulating dilute free chains and calculating their
mean square radius of gyration, < Rg >. For a single chain, < Rg >~ Ng where
V = 1/2 for a theta solvent, 0.59 for a good solvent and 1/3 for a poor solvent. Thus
the calculations for T* > Tg corresponds to a good solvent condition, and T*(< Tg)
corresponds to a poor solvent condition.
Figure 6.3a shows the density profile of polymer brushes in different solvent con-
160
More intriguing information
1. European Integration: Some stylised facts2. Secondary stress in Brazilian Portuguese: the interplay between production and perception studies
3. Three Strikes and You.re Out: Reply to Cooper and Willis
4. Evidence-Based Professional Development of Science Teachers in Two Countries
5. Micro-strategies of Contextualization Cross-national Transfer of Socially Responsible Investment
6. The name is absent
7. APPLICATIONS OF DUALITY THEORY TO AGRICULTURE
8. REVITALIZING FAMILY FARM AGRICULTURE
9. APPLYING BIOSOLIDS: ISSUES FOR VIRGINIA AGRICULTURE
10. The name is absent