38
measurements (n)
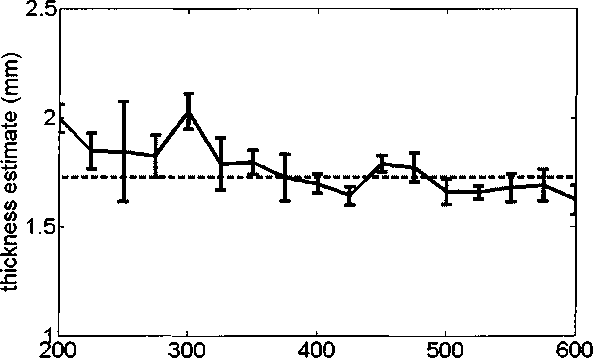
Figure 4.5 : The estimated thickness of the plastic plate, versus number of measure-
ments (n) used in CS reconstruction for the object in Figure 4.4. Dashed line indicates
the actual thickness difference (1.73 mm), as determined using a micrometer. The
thickness estimates rapidly converge to the correct answer with increasing n.
the amplitude image shows almost no contrast, the phase image shows a sharp con-
trast between the upper and lower halves of the rectangular aperture. The thickness
difference (∆d) can be estimated from the measured phase difference (Δ0) according
to ∆θ = ω^n~T^∙-ι which is valid since the plastic is essentially dispersionless. The ac-
quired data follows a linear relationship of ∆θ versus frequency, and the slope of that
line is used to estimate ∆d. Figure 4.5 shows the estimated value, for an increasing
number of CS measurements from 200 to 600. Compared to the value ∆d = 1.73 mm
determined with a micrometer, Figure 4.5 shows that the estimation results rapidly
converge to the correct answer, even for a small number of CS measurements. Another
reconstruction algorithm which assumes smoothness in the phase image yields even
better results [72]. Other recently developed algorithms for complex images might
even achieve better reconstruction results [73].
More intriguing information
1. Using Surveys Effectively: What are Impact Surveys?2. The demand for urban transport: An application of discrete choice model for Cadiz
3. Novelty and Reinforcement Learning in the Value System of Developmental Robots
4. Willingness-to-Pay for Energy Conservation and Free-Ridership on Subsidization – Evidence from Germany
5. Lending to Agribusinesses in Zambia
6. The name is absent
7. Migrant Business Networks and FDI
8. A Location Game On Disjoint Circles
9. The name is absent
10. Modellgestützte Politikberatung im Naturschutz: Zur „optimalen“ Flächennutzung in der Agrarlandschaft des Biosphärenreservates „Mittlere Elbe“