25
mV
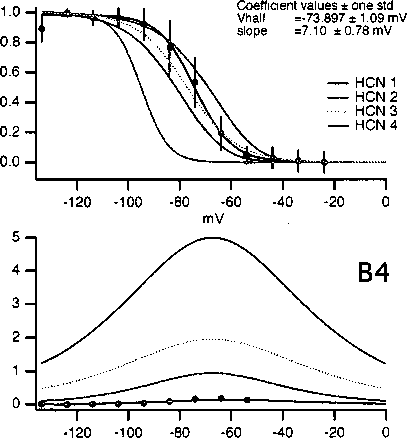
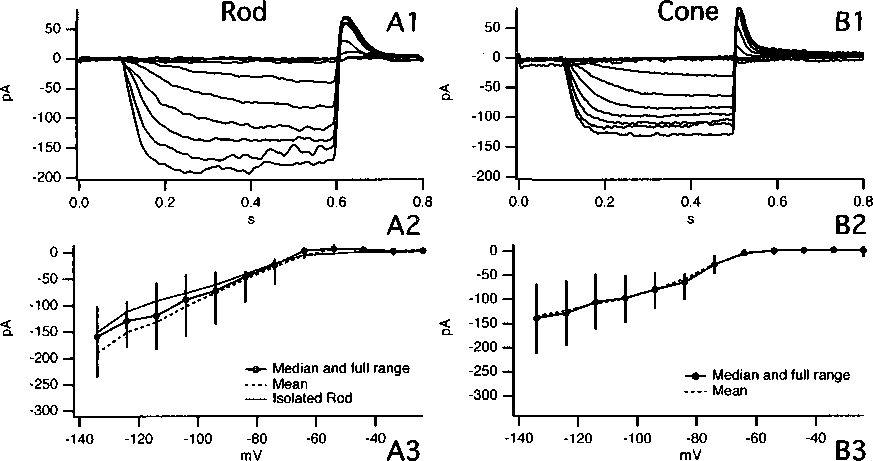
Figure 3.1 : Whole cell currents from voltage-clamp recordings from rod (A) and cone (B).
(Al) and (Bl) show example current traces. (A2) and (B2) showthe median IV curve values
with vertical bars representing the minimum and maximum range for 10 cells. (A3) and
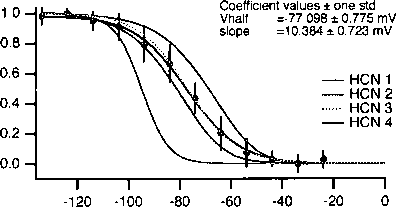
(B3) show the respective activation curves computed from the normalized and averaged
tail currents of 10 cells. Data is fit with a sigmoidal exponential function of the form: g =
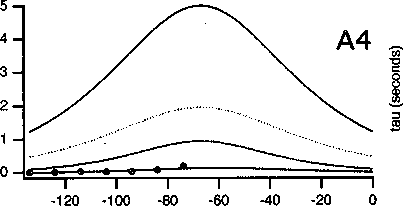
b + gmaχ∕(y + e^v~vhal^∣slσpe}. (A4) and (B4) show the activation time constants fit with a
single exponential for rod (A4) and cone (B4) data (black dots), with the color lines showing
values for HCNl,2,3, and 4. In (A3,4) and (B3,4), data for HCN 1, 2, and 4 come from
homogeneously expressed HCN channels (Altomare et al., 2001) plus estimated values for
expressed HCN3 (Stieber et al., 2005)
More intriguing information
1. The name is absent2. The name is absent
3. Anti Microbial Resistance Profile of E. coli isolates From Tropical Free Range Chickens
4. Industrial Employment Growth in Spanish Regions - the Role Played by Size, Innovation, and Spatial Aspects
5. Announcement effects of convertible bond loans versus warrant-bond loans: An empirical analysis for the Dutch market
6. Work Rich, Time Poor? Time-Use of Women and Men in Ireland
7. Review of “From Political Economy to Economics: Method, the Social and Historical Evolution of Economic Theory”
8. Reconsidering the value of pupil attitudes to studying post-16: a caution for Paul Croll
9. Innovation Policy and the Economy, Volume 11
10. Bidding for Envy-Freeness: A Procedural Approach to n-Player Fair Division Problems