36
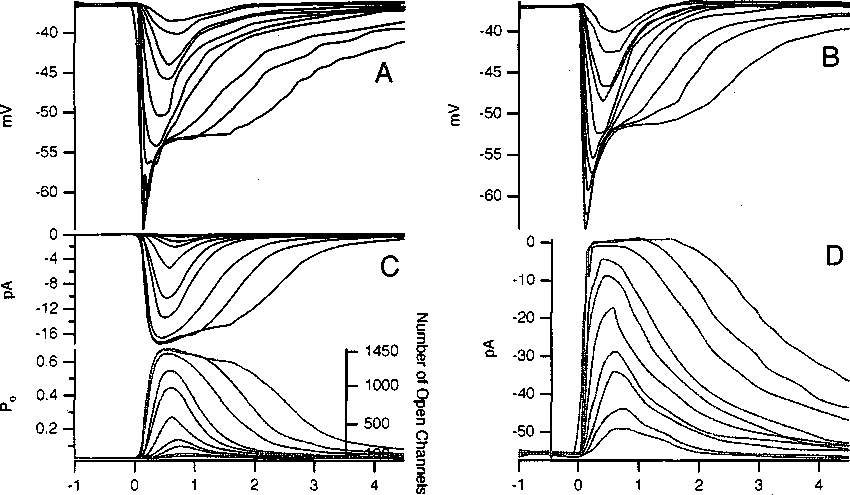
Figure 3.4 : Simulation analysis of rod photoreceptor function. (A) Simulated voltage re-
sponse of a rod to increasing light intensities. (B) Actual voltage response recorded simulta-
neously with the photocurrent in (D) from an isolated rod. Data for (B) and (D) taken from
Baylor et al, 1986. (C) ∕⅛ current and opening probability Po with corresponding number of
open HCN channels for each stimulus as predicted by simulation. Simulation parameters
are given in Appendix A.3
More intriguing information
1. Strengthening civil society from the outside? Donor driven consultation and participation processes in Poverty Reduction Strategies (PRSP): the Bolivian case2. Life is an Adventure! An agent-based reconciliation of narrative and scientific worldviews
3. CONSIDERATIONS CONCERNING THE ROLE OF ACCOUNTING AS INFORMATIONAL SYSTEM AND ASSISTANCE OF DECISION
4. The name is absent
5. A Note on Productivity Change in European Co-operative Banks: The Luenberger Indicator Approach
6. Poverty transition through targeted programme: the case of Bangladesh Poultry Model
7. The name is absent
8. Cryothermal Energy Ablation Of Cardiac Arrhythmias 2005: State Of The Art
9. Word Sense Disambiguation by Web Mining for Word Co-occurrence Probabilities
10. Rent Dissipation in Chartered Recreational Fishing: Inside the Black Box