Cone voltage response
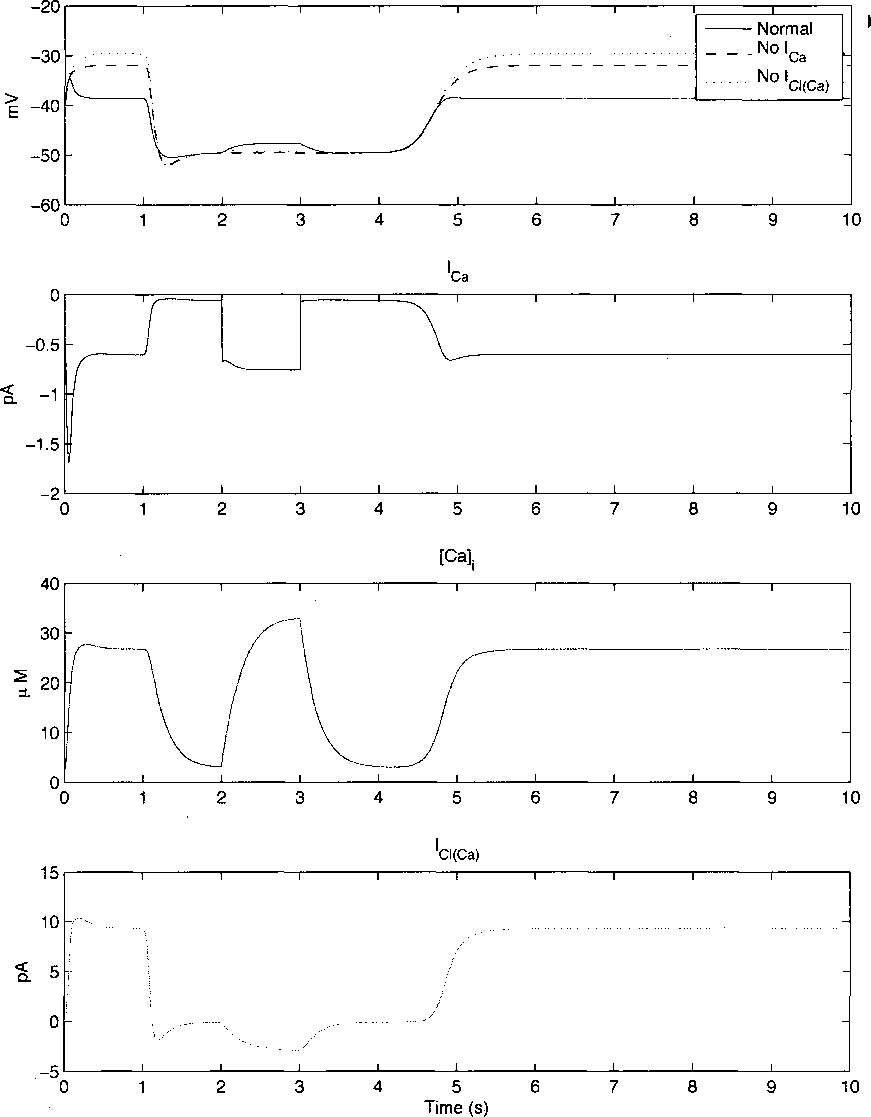
Figure 4.5 : Simulation of feedback from horizontal cell to cone. A step of light is applied to
the cone at t=l, and at t=2, a feedback signal that shifts the voltage activation curve of the
calcium current 10 mV to the left is applied. (A) The inhibitory depolarization is depen-
dent on both the activity of the calcium activation curve and a calcium activated chloride
conductance. (B) Shows the calcium current as a function of time. (C) Shows the calcium
concentration in the cell, modeled with a first order buffering system. (D) Shows the calcium
activated chloride current, which is the end effector causing depolarization in the cone.
More intriguing information
1. On Evolution of God-Seeking Mind2. The name is absent
3. The name is absent
4. Can genetic algorithms explain experimental anomalies? An application to common property resources
5. Neural Network Modelling of Constrained Spatial Interaction Flows
6. Howard Gardner : the myth of Multiple Intelligences
7. MULTIMODAL SEMIOTICS OF SPIRITUAL EXPERIENCES: REPRESENTING BELIEFS, METAPHORS, AND ACTIONS
8. Globalization, Divergence and Stagnation
9. DISCRIMINATORY APPROACH TO AUDITORY STIMULI IN GUINEA FOWL (NUMIDA MELEAGRIS) AFTER HYPERSTRIATAL∕HIPPOCAMP- AL BRAIN DAMAGE
10. AN EXPLORATION OF THE NEED FOR AND COST OF SELECTED TRADE FACILITATION MEASURES IN ASIA AND THE PACIFIC IN THE CONTEXT OF THE WTO NEGOTIATIONS