47
that there is no linear region of elastic deformation for these samples above this
value.
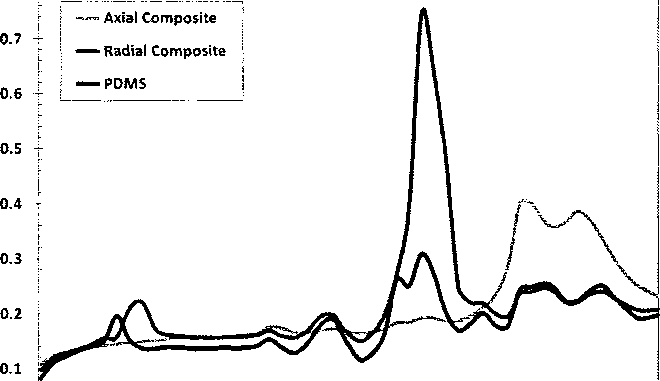
As displayed in Figure 3.7, the composites respond almost identically to the
neat polymer with the exception of two particular frequency ranges: 1) 57-70 Hz for
the radial test, and 2) 75-95 Hz for the axial test; frequency range #1 indicates a
significant spike in damping for the radial test, while frequency range #2 shows a
relatively similar enhancement for the axial test. An explanation for this behavior is
that at these frequencies, the samples were in resonance in the direction of the CNT
alignment. When in resonance along the length of the CNTs, greater interfacial
friction is likely to occur, which could reasonably explain the notable enhancement
in damping for those particular frequencies.
0.8
+∙>
Q
δ
и
C
,w
0
O
20
40 60
Frequency(Hz)
80 100
Figure 3.7 - Tangent delta for a frequency sweep DMA test.
More intriguing information
1. Midwest prospects and the new economy2. ARE VOLATILITY EXPECTATIONS CHARACTERIZED BY REGIME SHIFTS? EVIDENCE FROM IMPLIED VOLATILITY INDICES
3. The Context of Sense and Sensibility
4. Measuring Semantic Similarity by Latent Relational Analysis
5. Review of “From Political Economy to Economics: Method, the Social and Historical Evolution of Economic Theory”
6. Correlates of Alcoholic Blackout Experience
7. Gerontocracy in Motion? – European Cross-Country Evidence on the Labor Market Consequences of Population Ageing
8. The name is absent
9. 101 Proposals to reform the Stability and Growth Pact. Why so many? A Survey
10. Ex post analysis of the regional impacts of major infrastructure: the Channel Tunnel 10 years on.