ON THE ANALYSIS OF LIBRARY GROWTH
83
O
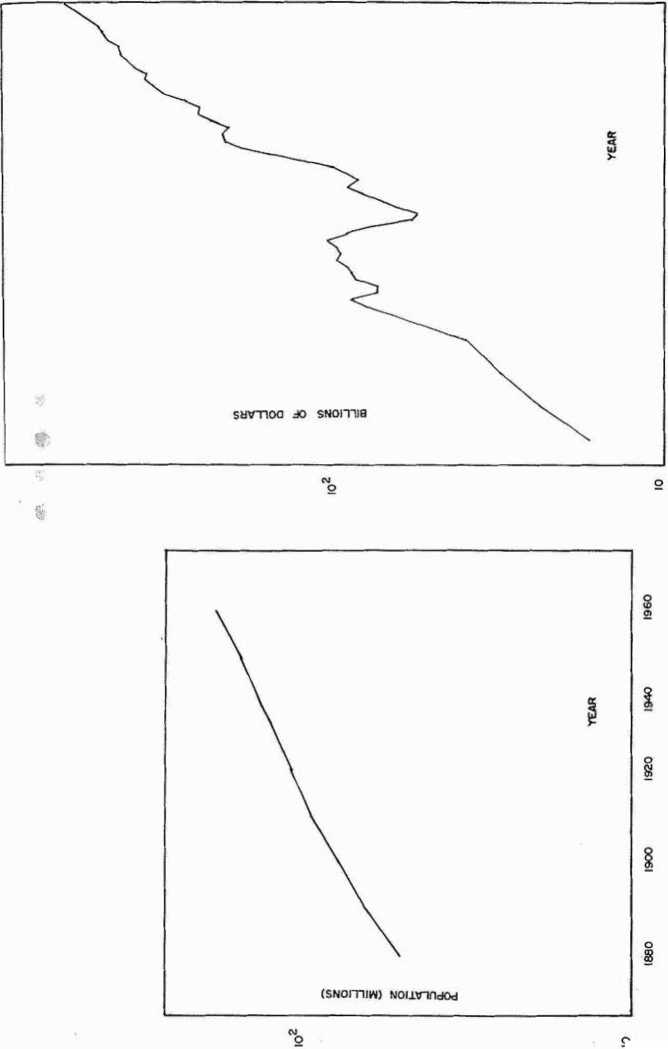
I9OO 1910 1920 1930 1940 1950 I960
FIGURE 26. U. S. PGpuhlion 1880-1960 with a 5.89 year correction. FIGURE 17. U. S. GtOss Nalionst Product in current dollars.
More intriguing information
1. Evaluation of the Development Potential of Russian Cities2. A THEORETICAL FRAMEWORK FOR EVALUATING SOCIAL WELFARE EFFECTS OF NEW AGRICULTURAL TECHNOLOGY
3. Delivering job search services in rural labour markets: the role of ICT
4. Estimated Open Economy New Keynesian Phillips Curves for the G7
5. Informal Labour and Credit Markets: A Survey.
6. Innovation Trajectories in Honduras’ Coffee Value Chain. Public and Private Influence on the Use of New Knowledge and Technology among Coffee Growers
7. The name is absent
8. The name is absent
9. The name is absent
10. Testing Panel Data Regression Models with Spatial Error Correlation