Using the Corporate Tax Data Base provided by the Institute for Fiscal Studies
(IFS) and described and analyzed in Devereux, Griffith & Klemm (2002), diagram
1 depicts each change in the statutory tax rates and the PVDA4 of the OECD
countries enumerated in footnote 1 in the years 1982-2003. The æ-axis measures
changes of the tax rate, the ^-axis the variation in the tax base. Data points which
are not on the axes present a simultaneous change of the tax rate and the tax base.
Thus, we get four quadrants among which two are (potentially) revenue-neutral,
because the variation of one tax parameter is “financed” by the variation of the
other one. In addition, as long as the tax system is on the increasing part of the
Laffer curve, tax reforms in quadrant II are clearly revenue-decreasing and those
in quadrant IV are revenue-increasing.
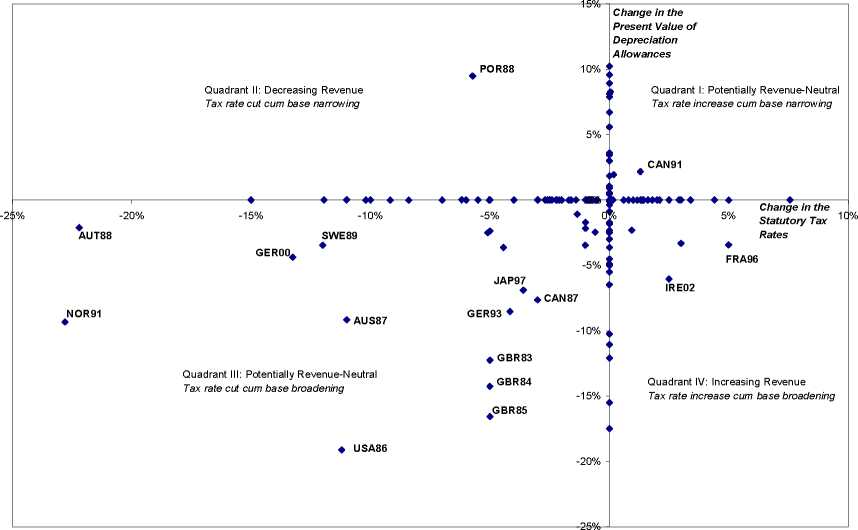
Diagram 1: Tax reforms in different OECD countries 1982-2003. Data source:
Devereux et al. (2002).
As the diagram shows, a great deal of tax policy reforms consists of a variation
4The change in the PVDA is calculated as an unweighted average of the changes in the PVDA
of plant and machinery and the PVDA of industrial buildings.
More intriguing information
1. AN ECONOMIC EVALUATION OF COTTON AND PEANUT RESEARCH IN SOUTHEASTERN UNITED STATES2. Social Cohesion as a Real-life Phenomenon: Exploring the Validity of the Universalist and Particularist Perspectives
3. Fiscal Policy Rules in Practice
4. The name is absent
5. The name is absent
6. Visual Perception of Humanoid Movement
7. The name is absent
8. The name is absent
9. The Employment Impact of Differences in Dmand and Production
10. The name is absent