Traditional sectors with lower Ateco 1991 code, i.e. Food and Beverages, Textiles, Clothes,
Tobacco, tend to be underrepresented with respect to the original Capitalia sample, as we can see
from Figure A2. In any case if we consider High-Tech versus the others, there is an independent
distribution of frequencies in and out of sample (Pearson chi-square(1) test = 0.3952 with p-
value=0.530).
We then run a two-sample t test with equal variances to test for equality of average firm age
between the two groups (in-sample, out-sample). The results highlight that firms outside the sample
are on average 3 years older, and the difference in means is statistically significant.
Figure A 2. Distribution of firms by Ateco 1991 classification, in and out-sample
Distribution of firms by Sectors in and out of sample
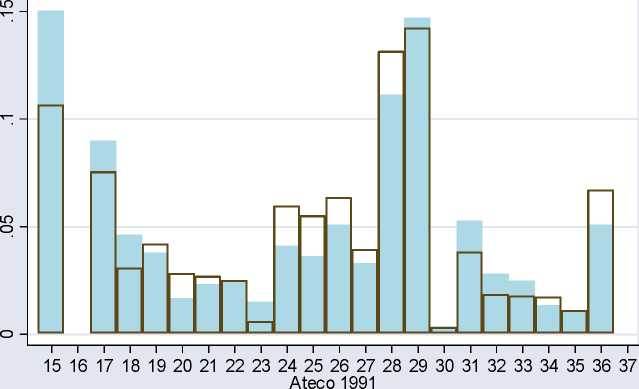
out of sample I I in-sample
|
Group |
Obs |
Mean |
Std. Err. |
Std. Dev. |
[95% Conf. Interval] | |
|
Out sample |
-570 |
31.87 |
.938 |
22.41 |
30.03 |
33.72 |
|
In sample |
3469 |
28.87 |
.325 |
19.16 |
28.24 |
29.51 |
|
Combined |
4039 |
29.29 |
.309 |
19.67 |
28.69 |
29.90 |
|
“diff |
3.00 |
.887 |
1.259 |
4.742 | ||
Degrees of freedom: 4037
30
More intriguing information
1. The name is absent2. The name is absent
3. The name is absent
4. The Shepherd Sinfonia
5. Fertility in Developing Countries
6. Bargaining Power and Equilibrium Consumption
7. Computing optimal sampling designs for two-stage studies
8. EU enlargement and environmental policy
9. The name is absent
10. Getting the practical teaching element right: A guide for literacy, numeracy and ESOL teacher educators