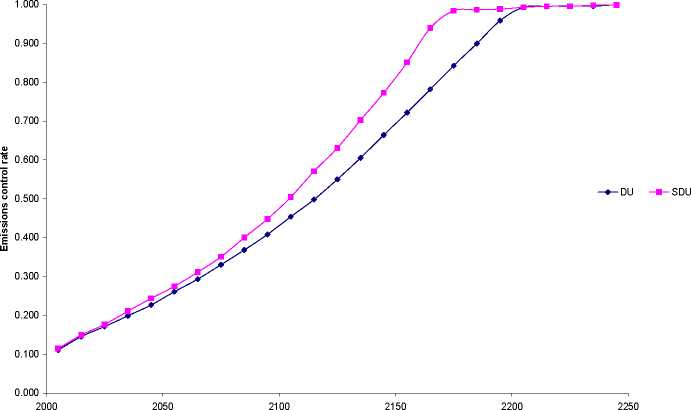
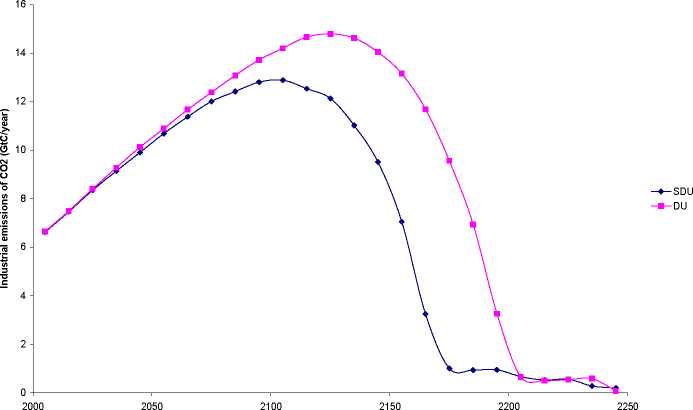
Figure 3: Optimal emissions under SDU and DU in terms of (top) the emissions
control rate and (bottom) mean annual industrial CO2 emissions.
27
More intriguing information
1. The name is absent2. Standards behaviours face to innovation of the entrepreneurships of Beira Interior
3. A THEORETICAL FRAMEWORK FOR EVALUATING SOCIAL WELFARE EFFECTS OF NEW AGRICULTURAL TECHNOLOGY
4. Momentum in Australian Stock Returns: An Update
5. Locke's theory of perception
6. Automatic Dream Sentiment Analysis
7. The effect of classroom diversity on tolerance and participation in England, Sweden and Germany
8. A Computational Model of Children's Semantic Memory
9. A Bayesian approach to analyze regional elasticities
10. The name is absent