Table I. Annual Depreciation Rates by Categories4
|
Categories |
Equipment |
Structures |
Depreciation |
|
Road |
— |
0.0202 |
0.0202 |
|
Railways |
0.0589 |
0.0275 |
0.0328 |
|
Electricity |
0.050 |
0.0211 |
0.0260 |
|
Gas |
— |
0.0237 |
0.0237 |
|
Water |
— |
0.0152 |
0.0152 |
|
Telecoms |
0.1375 |
0.0237 |
0.0429 |
Note: For each asset, the depreciation rate is defined
as a weighted average of the corresponding rates used for
equipments and structures. The depreciation rates for
equipment and structures are taken from Bureau of Eco-
nomic Analysis (2003), table C, page M-31.
Figure 1 Non-Parametric Estimated Efficiency Function of Public Investments
in Streets and Highways. United States, 1951-1992 (US$ million, Historical Cost)
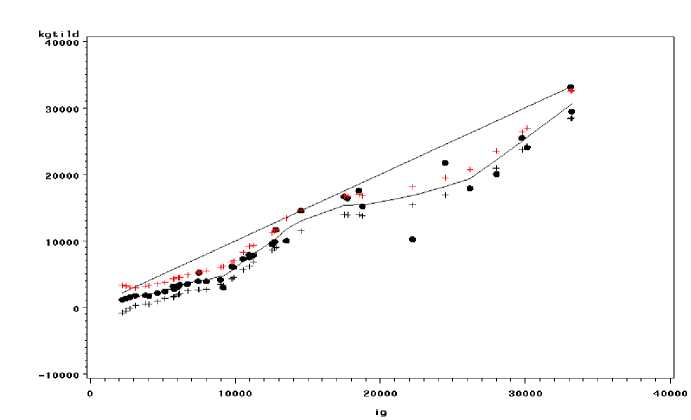
Notes: For each estimated point, the corresponding 95% confidence limits are represented by a sign ” + ”
More intriguing information
1. The name is absent2. The purpose of this paper is to report on the 2008 inaugural Equal Opportunities Conference held at the University of East Anglia, Norwich
3. Structural Breakpoints in Volatility in International Markets
4. The fundamental determinants of financial integration in the European Union
5. The name is absent
6. THE CO-EVOLUTION OF MATTER AND CONSCIOUSNESS1
7. THE USE OF EXTRANEOUS INFORMATION IN THE DEVELOPMENT OF A POLICY SIMULATION MODEL
8. The name is absent
9. The Demand for Specialty-Crop Insurance: Adverse Selection and Moral Hazard
10. Keystone sector methodology:network analysis comparative study