326
Journal of Agricultural and Applied Economics, April 2008
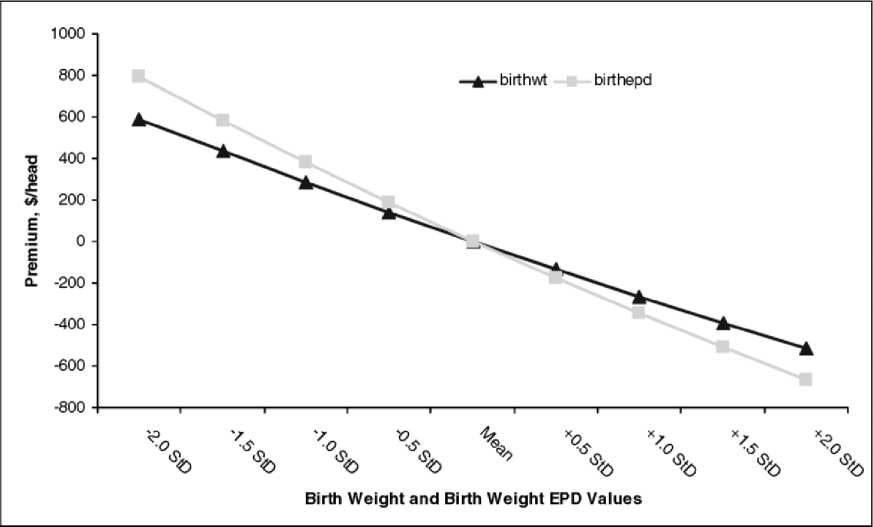
Figure 1. Predicted Premiums for Birth Weight and Birth-Weight EPD
premiums were then transformed from log to
linear form, as suggested by Miller.
When calculating this sensitivity analysis
for a variable, such as birthwt, typically all
other continuous variables are held constant
at their mean. However, it is not appropriate
in this case to hold birthepd constant because
of the high statistical correlation between
birthepd and its associated physical character-
istic birthwt. Specifically, as birthwt moves
away from its mean, it is unlikely that birthepd
will remain at its mean. To account for this,
relationships between these two variables were
estimated using OLS (regressing birthepd on
birthwt and vice versa, yearepd on adjyearwt
and vice versa, and so on). These estimated
relationships were then used in the calculation
of the sensitivity of price to each variable of
interest. As an example, when calculating
expected premiums for birthwt across a range
of 62 standard deviations of birth weight, the
mean value for birthepd is replaced by the
estimated regression equation (which is a
function of birth weight) to more accurately
reflect the true relationship between price and
birth weight as birthwt changes over the two-
standard-deviation range.
Figure 1 depicts the comparison of the
premiums for birthwt and birthepd. For exam-
ple, the calculated average premium for a bull
with an actual birth weight that is one standard
deviation below the mean is $284, while the
calculated average premium for a bull with a
birth-weight EPD that is one standard devia-
tion below the mean is $380. Calculated in this
manner, birthepd has slightly larger premiums
associated with it relative to birthwt for equally
likely changes of each variable. On the basis of
this criterion, it can be argued that birthepd is
the more significant genetic measure despite
the higher elasticity of birthwt.
The same argument cannot be made for
yearepd, however. Figure 2 shows that premi-
ums associated with adjyearwt are larger
relative to yearepd premiums across two
standard deviations when the relationship
between these two variables is accounted for.
As an illustration, the calculated premium for
a bull with an adjusted yearling weight one
standard deviation above the mean is $766,
while the calculated premium for a bull with a
yearling-weight EPD one standard deviation
above the mean is only $613. Thus, while
buyers may pay higher premiums for the
More intriguing information
1. The name is absent2. News Not Noise: Socially Aware Information Filtering
3. The name is absent
4. HACCP AND MEAT AND POULTRY INSPECTION
5. Novelty and Reinforcement Learning in the Value System of Developmental Robots
6. The name is absent
7. Protocol for Past BP: a randomised controlled trial of different blood pressure targets for people with a history of stroke of transient ischaemic attack (TIA) in primary care
8. Education Responses to Climate Change and Quality: Two Parts of the Same Agenda?
9. THE ECONOMICS OF COMPETITION IN HEALTH INSURANCE- THE IRISH CASE STUDY.
10. Two-Part Tax Controls for Forest Density and Rotation Time