350
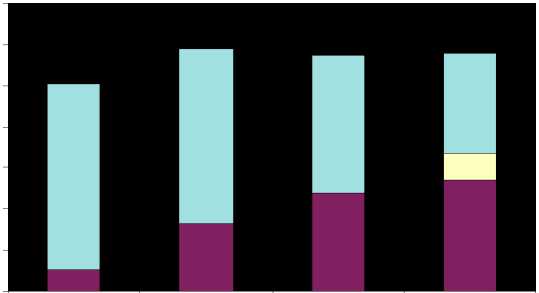
Figure 3: Participation of 16-19 year olds in work-based training
300
250
200
150
100
50
|
95/6 |
96/7 |
97/8 |
98/9 | |
|
□ Other Training____________ |
224.2 |
212.7 |
166 |
121.3 |
|
□ National Traineeships______ |
0.9 |
31.7 | ||
|
и Modern Apprenticeships |
27.8 |
81.9 |
118.8 |
135.7 |
Source: DfEE (1999e) SFR 46/99
350
і.ч
Figure 4: 16-19 year olds starting on the work-based route
300
250
200
150
100
50

95/6
96/7
97/8
98/9
0
|
и Other Training |
268.1 |
257.3 |
199.6 |
131.5 |
|
N NTs_________ |
0.9 |
41.9 | ||
|
И MAs________ |
28.4 |
75.6 |
87.7 |
87.4 |
Source: DfEE (1999e) SFR 46/99
More intriguing information
1. Rural-Urban Economic Disparities among China’s Elderly2. Olfactory Neuroblastoma: Diagnostic Difficulty
3. An institutional analysis of sasi laut in Maluku, Indonesia
4. EMU: some unanswered questions
5. Learning and Endogenous Business Cycles in a Standard Growth Model
6. ENVIRONMENTAL POLICY: THE LEGISLATIVE AND REGULATORY AGENDA
7. INTERPERSONAL RELATIONS AND GROUP PROCESSES
8. Expectations, money, and the forecasting of inflation
9. A parametric approach to the estimation of cointegration vectors in panel data
10. Parallel and overlapping Human Immunodeficiency Virus, Hepatitis B and C virus Infections among pregnant women in the Federal Capital Territory, Abuja, Nigeria