Unilever vs. S&P 500 Price Index
November 1996 = 100
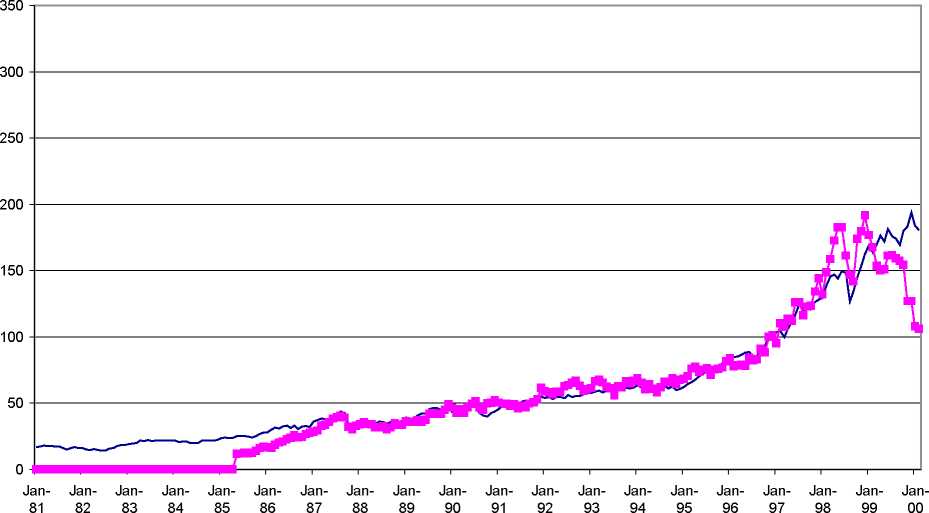
I S&P 500 Unilever7I
Safeway vs. S&P 500 Price Index
November 1996 = 100
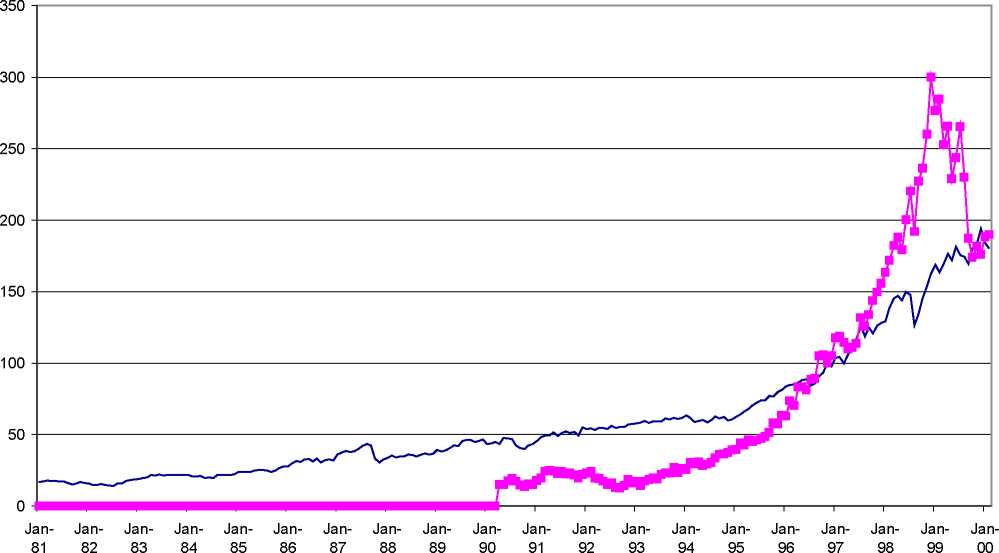
I S&P 500 Safeway ∣
A-6
More intriguing information
1. Global Excess Liquidity and House Prices - A VAR Analysis for OECD Countries2. The name is absent
3. Testing for One-Factor Models versus Stochastic Volatility Models
4. Distribution of aggregate income in Portugal from 1995 to 2000 within a SAM (Social Accounting Matrix) framework. Modeling the household sector
5. Smith and Rawls Share a Room
6. The name is absent
7. IMPLICATIONS OF CHANGING AID PROGRAMS TO U.S. AGRICULTURE
8. Der Einfluß der Direktdemokratie auf die Sozialpolitik
9. Olive Tree Farming in Jaen: Situation With the New Cap and Comparison With the Province Income Per Capita.
10. Business Cycle Dynamics of a New Keynesian Overlapping Generations Model with Progressive Income Taxation