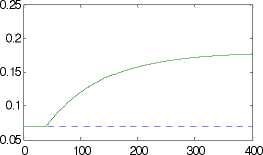
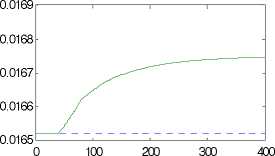
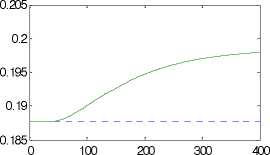
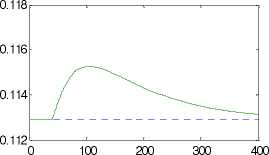
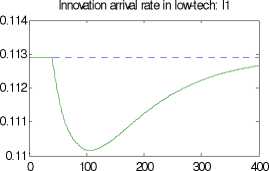
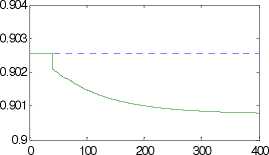
Figure 3. Transitional dynamics
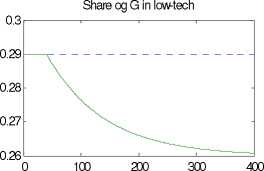
Share of G in high-tech
Skilled employment in efficiency units: h
Difficulty index in high-tech: X2
Innovation arrival rate in high-tech: I2
Unskilled employment in efficiency units: m

Difficulty index in low-tech: X1
0.111----------------------.----------------------.----------------------.----------------------
0.105---------------------■
0.1 ∙ -
0.0951----------------'----------------'----------------'----------------
0 100 200 300 400
Relative employment of unskilled workers: θ
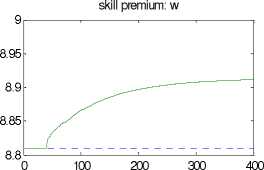
Average skill premium
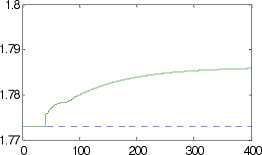
Note: the dotted lines represent the initial position of the economy
30
More intriguing information
1. The Advantage of Cooperatives under Asymmetric Cost Information2. The Integration Order of Vector Autoregressive Processes
3. An alternative way to model merit good arguments
4. Portuguese Women in Science and Technology (S&T): Some Gender Features Behind MSc. and PhD. Achievement
5. THE ECONOMICS OF COMPETITION IN HEALTH INSURANCE- THE IRISH CASE STUDY.
6. An Investigation of transience upon mothers of primary-aged children and their school
7. The bank lending channel of monetary policy: identification and estimation using Portuguese micro bank data
8. Effort and Performance in Public-Policy Contests
9. Input-Output Analysis, Linear Programming and Modified Multipliers
10. AGRICULTURAL TRADE IN THE URUGUAY ROUND: INTO FINAL BATTLE