Figures
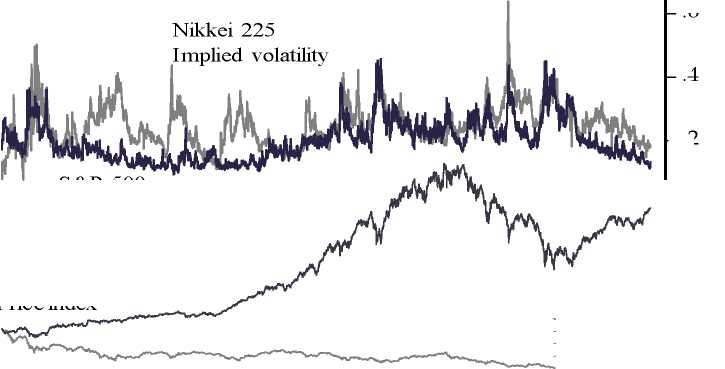
Figure 1. The behavior of stock prices benchmarks and implied volatility indices
(Stock price indices rebased to 100 as of January 2, 1990)
.8
Stock price index
- .6
500-
400-
300-
- .4
- .2
Implied volatility index
-.0
Nikkei 225
Price index
90 91 92 93 94 95 96 97 98 99 00 01 02 03 04
S&P 500
Implied volatility
200- S&P 500
Price index
100-
26
More intriguing information
1. THE CHANGING RELATIONSHIP BETWEEN FEDERAL, STATE AND LOCAL GOVERNMENTS2. Prevalence of exclusive breastfeeding and its determinants in first 6 months of life: A prospective study
3. The name is absent
4. Motivations, Values and Emotions: Three Sides of the same Coin
5. Yield curve analysis
6. Weather Forecasting for Weather Derivatives
7. Modelling the Effects of Public Support to Small Firms in the UK - Paradise Gained?
8. Keystone sector methodology:network analysis comparative study
9. The name is absent
10. The name is absent