Table 2. Delinquency for Farmers Home Administration Loans,
____________________September 30, 1985____________________
|
Geographic area and |
Active |
Delinquent |
Delinquent |
|
United Sûtes: |
number |
number |
percent |
|
Farm ownership, individual .. |
... 124,909 |
26,007 |
21 |
|
Emergency, individual .......... |
... 121,709 |
47,276 |
39 |
|
Rural housing, individual ..... (monthly payments) |
... 911,060 |
185,997 |
20 |
|
Farm ownership, individual .. |
... 2,669 |
835 |
31 |
|
Emergency, individual .......... |
... 5,403 |
3,764 |
70 |
|
Rural housing, individual ..... (monthly payments) Iowa: |
... 32,801 |
7,620 |
23 |
|
Farm ownership, individual .. |
... 5,210 |
969 |
19 |
|
Emergency, individual .......... |
... 6,867 |
1,620 |
24 |
|
Rural housing, individual ..... (monthly payments)_______ |
... 18,809 |
2,788 |
15 |
Source: USDA (c).
delinquency rate of 20 percent during Sep-
tember 1985, Table 2.
Delinquency rates experienced by the
FmHA varied substantially by state. In Geor-
gia, the farm ownership loans were 31 per-
cent delinquent during September 1985 and
the individual rural housing loans with
monthly payments were 23 percent delin-
quent. Iowa had a farm ownership delin-
quency rate of 19 percent and an individual
rural housing delinquency rate was 15 per-
cent. Most other midwestern states had rates
in this range.
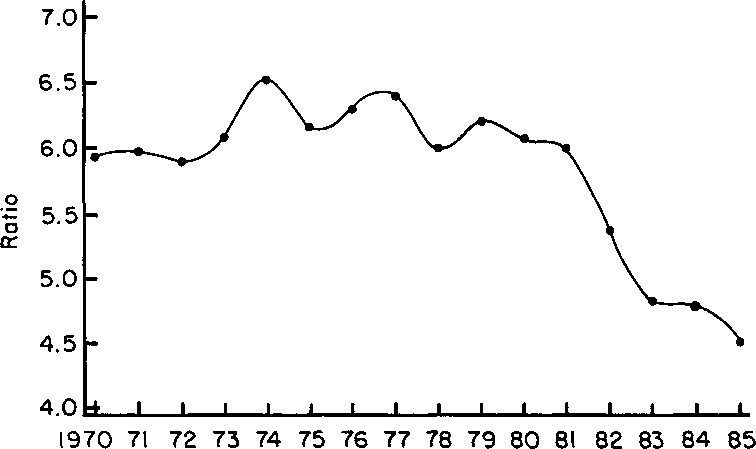
The crisis of asset value relative to debt is
made obvious by the asset-to-debt ratio from
the farm balance sheet, Figure 1. Since the
early 1980s, asset value has declined faster
than debt. An average ratio of about $6.00
of assets for each $ 1.00 of debt existed during
the 1970s. The ratio declined to about $4.50
per $1.00 during 1985. Changes in the asset-
to-debt ratio during the 1980s varied sub-
stantially by region of the country. The United
States average decline was about 20 percent,
Figure 2. The Southeast experienced a 17
percent decline, while the Corn Belt had the
largest drop at more than 30 percent and the
Southern Plains had the lowest decline at
near 2 percent (GAO, ρ. 26).
Farmland is the major asset owned by most
farmers. High commodity prices and robust
farm income during the early 1970’s fueled
farmers’ expectations and placed upward
pressures on farmland prices. The upward
trend was reversed in the early 1980s. From
1981-85, land prices dropped dramatically,
.Figure 3. In some states, the decline was
more than 50 percent. Repercussions from
this decline are currently being addressed by
farm lending institutions and the Farm Credit
System.
Higher commodity prices followed by
higher land prices during the 1970s also
caused a shift in the liquidity of farmers. This
shift affected their ability to repay borrowed
funds during the 1980s. During the 1970s,
liquid assets such as livestock were sold and
104
Year
Figure 1. Farm Asset-to-Debt Ratio, United States, 1970-85. Source: GAO, p. 18.
More intriguing information
1. ESTIMATION OF EFFICIENT REGRESSION MODELS FOR APPLIED AGRICULTURAL ECONOMICS RESEARCH2. The Formation of Wenzhou Footwear Clusters: How Were the Entry Barriers Overcome?
3. The name is absent
4. Motivations, Values and Emotions: Three Sides of the same Coin
5. Qualification-Mismatch and Long-Term Unemployment in a Growth-Matching Model
6. The name is absent
7. Yield curve analysis
8. Valuing Access to our Public Lands: A Unique Public Good Pricing Experiment
9. Tourism in Rural Areas and Regional Development Planning
10. Conservation Payments, Liquidity Constraints and Off-Farm Labor: Impact of the Grain for Green Program on Rural Households in China