Stata Technical Bulletin
45
Sample size according to kappa values (p1=0.2, p2=0.2)
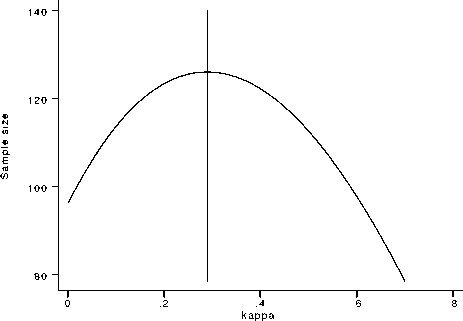
Figure 2. An example of using “Graph S”.
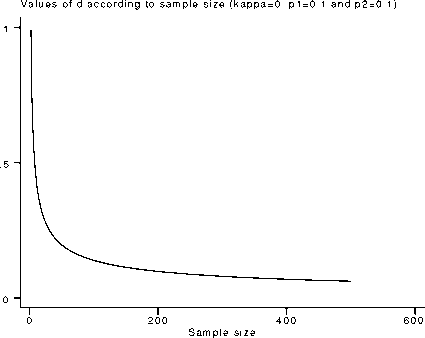
Figure 3. An example using “Graph D”.
Figure 3 illustrates a “Graph D” output for the default values.
Note that the graph’s default values of 0 to 500 were left unchanged in the “X:ssize” edit boxes. Yet, for the parameters at
hand, this graph is not very informative since the sample size spectrum where the decline of most precision values takes place is
quite small. The researcher would need a much narrower sample size range over which the d values decrease less steeply. This
enhanced picture would allow him/her to make a better decision, reaching a compromise between a viable sample size and an
acceptable precision for the kappa estimates. This zooming is illustrated in Figure 4 where the “X:ssize” edit boxes have been
changed to 50 to 250. Note the tighter range of the d values on the vertical axis, now comprising a more realistic set of figures
to assess precision.
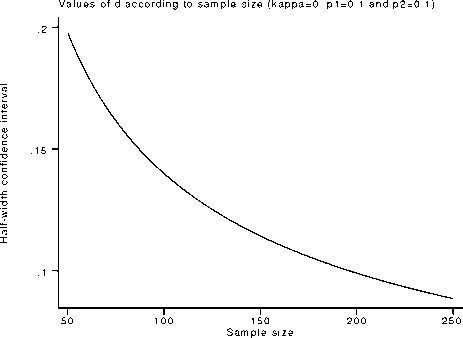
Figure 4. Using the zoom feature.
References
Cantor, A. B. 1996. Sample size calculations for Cohen’s k. Psychological Methods 1: 150-153.
Donner, A. and M. Eliasziw. 1992. A goodness-of-fit approach to inference procedures for the kappa statistic: confidence interval construction,
significance-testing and sample size estimation. Statistics in Medicine 11: 1511-1519.
Fleiss, J. L., 1981. Statistical Methods for Rates and Proportions. 2d ed. New York: John Wiley & Sons.
Fleiss, J. L., J. Cohen, and B. S. Everitt. 1969. Large sample standard errors for kappa and weighted kappa. Psychological Bulletin 72: 323-327.
Linnet, K. 1987. Comparison of quantitative diagnostic tests: type I error, power, and sample size. Statistics in Medicine 6: 147-158.
Shrout, P. E. and S. C. Newman. 1989. Design of two-phase prevalence surveys of rare disorders. Biometrics 45: 549-555.
Statistical Solutions. 1999. nQuery Advisor 3.0. Saugus, MA.
Walter, S. D., M. Eliasziw, and A. Donner. 1998. Sample size and optimal design for reliability studies. Statistics in Medicine 17: 101-110.
More intriguing information
1. The Macroeconomic Determinants of Volatility in Precious Metals Markets2. Multiple Arrhythmogenic Substrate for Tachycardia in a
3. Une Classe de Concepts
4. Input-Output Analysis, Linear Programming and Modified Multipliers
5. The name is absent
6. Asymmetric transfer of the dynamic motion aftereffect between first- and second-order cues and among different second-order cues
7. Road pricing and (re)location decisions households
8. News Not Noise: Socially Aware Information Filtering
9. The name is absent
10. The name is absent