14
12
10
8
6
4
6
4
2
0
-2
Figure 7
Model-Based Level, Slope and Curvature (i.e., Estimated Factors)
vs. Data-Based Level, Slope and Curvature
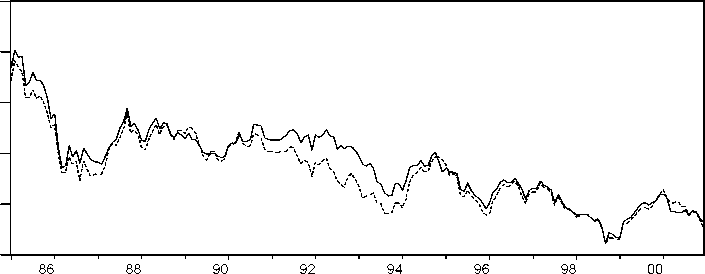
Solid Line: βι r Dotted Line: Level
86 88 90 92 94 96 98 00
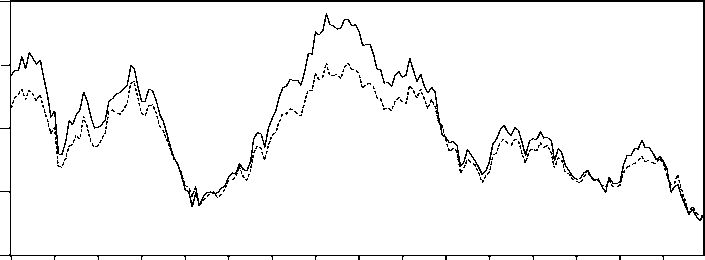
Solid Line: -β2t Dotted Line: Slope
2

-2 -I----------------1-----------------1-----------------1-----------------1---------------->-----------------1-----------------1---------------->-----------------1---------------->---------------->-----------------1---------------->---------------->----------------F
86 88 90 92 94 96 98 00
л
Solid Line: 0.3 β31 Dotted Line: Curvature
Notes to Figure 7: We define the level as the 10-year yield, the slope as the difference between the 10-year
and 3-month yields, and the curvature as the twice the 2-year yield minus the sum of the 3-month and 10-
year yields.
More intriguing information
1. Cardiac Arrhythmia and Geomagnetic Activity2. Tobacco and Alcohol: Complements or Substitutes? - A Statistical Guinea Pig Approach
3. Fiscal Reform and Monetary Union in West Africa
4. Magnetic Resonance Imaging in patients with ICDs and Pacemakers
5. TOWARDS THE ZERO ACCIDENT GOAL: ASSISTING THE FIRST OFFICER MONITOR AND CHALLENGE CAPTAIN ERRORS
6. The name is absent
7. The name is absent
8. Word searches: on the use of verbal and non-verbal resources during classroom talk
9. On the Existence of the Moments of the Asymptotic Trace Statistic
10. Permanent and Transitory Policy Shocks in an Empirical Macro Model with Asymmetric Information