Figure 6
Yield Curve Residuals, 1985.01 - 2000.12
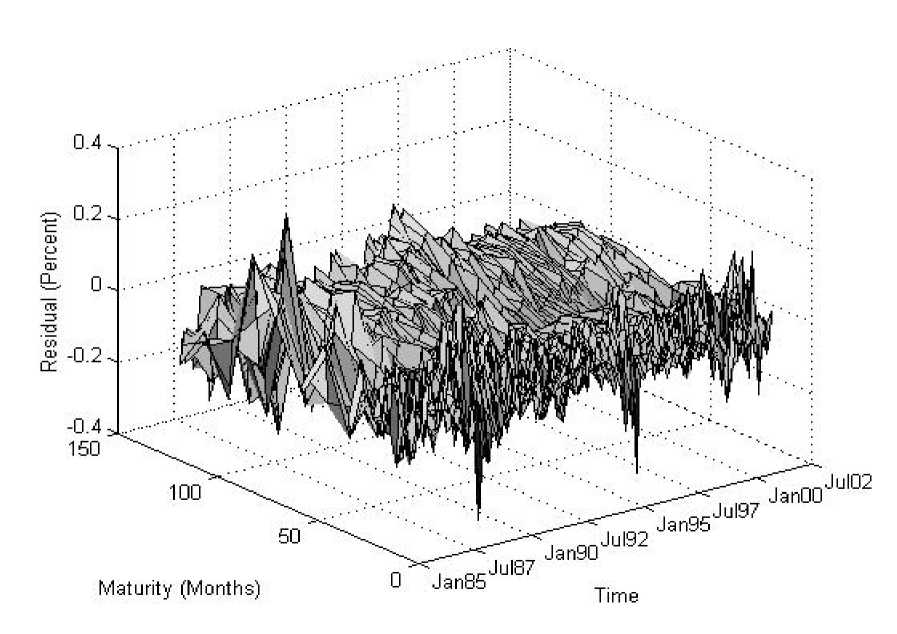
Notes to Figure 6: We plot residuals from Nelson-Siegel yield curves fitted month-by-month. See text for
details.
More intriguing information
1. Benefits of travel time savings for freight transportation : beyond the costs2. How does an infant acquire the ability of joint attention?: A Constructive Approach
3. The Mathematical Components of Engineering
4. Heavy Hero or Digital Dummy: multimodal player-avatar relations in FINAL FANTASY 7
5. The economic doctrines in the wine trade and wine production sectors: the case of Bastiat and the Port wine sector: 1850-1908
6. EDUCATIONAL ACTIVITIES IN TENNESSEE ON WATER USE AND CONTROL - AGRICULTURAL PHASES
7. The geography of collaborative knowledge production: entropy techniques and results for the European Union
8. The name is absent
9. An Efficient Circulant MIMO Equalizer for CDMA Downlink: Algorithm and VLSI Architecture
10. Initial Public Offerings and Venture Capital in Germany