Figure 3
Median Data-Based Yield Curve with Pointwise Interquartile Range
Yield (Percent)
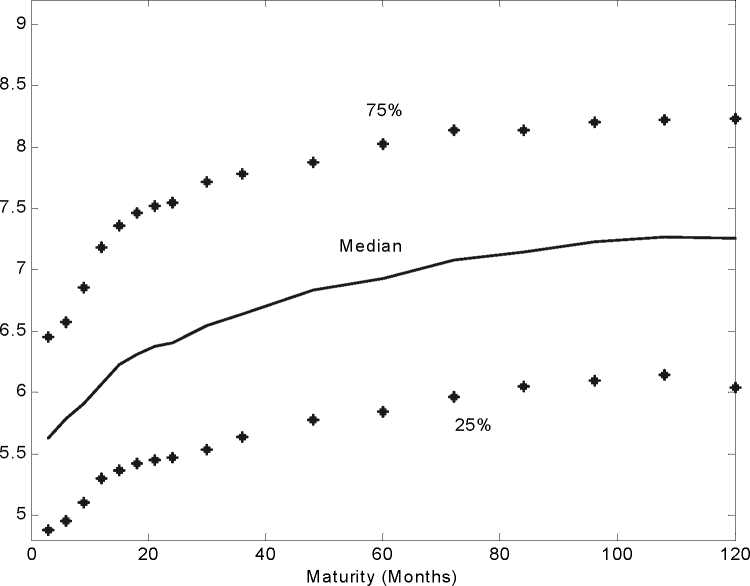
Notes to Figure 3: For each maturity, we plot the median yield along with the twenty-fifth and seventy-
fifth percentiles.
More intriguing information
1. National curriculum assessment: how to make it better2. A Rational Analysis of Alternating Search and Reflection Strategies in Problem Solving
3. The name is absent
4. Proceedings from the ECFIN Workshop "The budgetary implications of structural reforms" - Brussels, 2 December 2005
5. The name is absent
6. The constitution and evolution of the stars
7. ALTERNATIVE TRADE POLICIES
8. Work Rich, Time Poor? Time-Use of Women and Men in Ireland
9. The name is absent
10. Influence of Mucilage Viscosity On The Globule Structure And Stability Of Certain Starch Emulsions