Figure 2
Yield Curves, 1985.01-2000.12
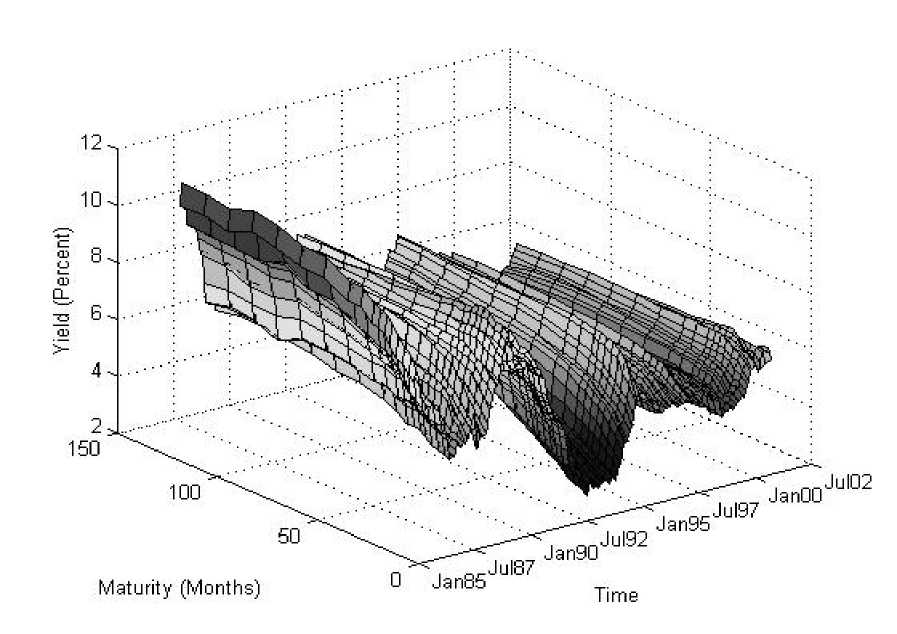
Notes to Figure 2: The sample consists of monthly yield data from January 1985 to December 2000 at
maturities of 3, 6, 9, 12, 15, 18, 21, 24, 30, 36, 48, 60, 72, 84, 96, 108, and 120 months.
More intriguing information
1. The name is absent2. The name is absent
3. Trade and Empire, 1700-1870
4. An Efficient Secure Multimodal Biometric Fusion Using Palmprint and Face Image
5. Elicited bid functions in (a)symmetric first-price auctions
6. Should Local Public Employment Services be Merged with the Local Social Benefit Administrations?
7. Can a Robot Hear Music? Can a Robot Dance? Can a Robot Tell What it Knows or Intends to Do? Can it Feel Pride or Shame in Company?
8. The name is absent
9. Survey of Literature on Covered and Uncovered Interest Parities
10. The name is absent