14
12
10
8
6
4
6
4
2
0
-2
Figure 7
Model-Based Level, Slope and Curvature (i.e., Estimated Factors)
vs. Data-Based Level, Slope and Curvature
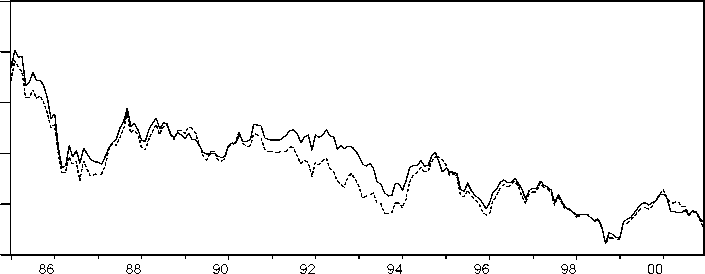
Solid Line: βι r Dotted Line: Level
86 88 90 92 94 96 98 00
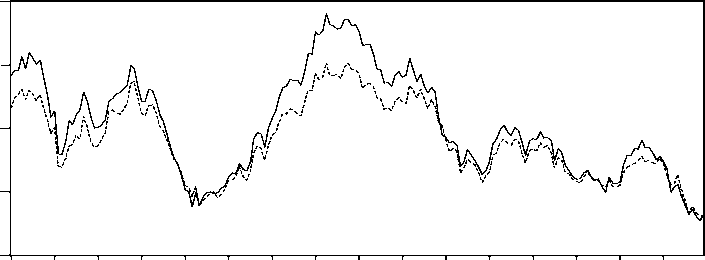
Solid Line: -β2t Dotted Line: Slope
2
-2 -I----------------1-----------------1-----------------1-----------------1---------------->-----------------1-----------------1---------------->-----------------1---------------->---------------->-----------------1---------------->---------------->----------------F
86 88 90 92 94 96 98 00
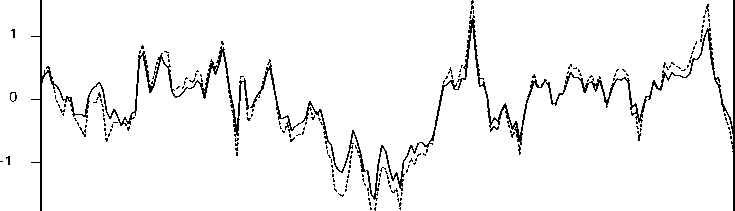
л
Solid Line: 0.3 β31 Dotted Line: Curvature
Notes to Figure 7: We define the level as the 10-year yield, the slope as the difference between the 10-year
and 3-month yields, and the curvature as the twice the 2-year yield minus the sum of the 3-month and 10-
year yields.
More intriguing information
1. The name is absent2. Better policy analysis with better data. Constructing a Social Accounting Matrix from the European System of National Accounts.
3. Industrial districts, innovation and I-district effect: territory or industrial specialization?
4. Stakeholder Activism, Managerial Entrenchment, and the Congruence of Interests between Shareholders and Stakeholders
5. The name is absent
6. A Note on Productivity Change in European Co-operative Banks: The Luenberger Indicator Approach
7. Consumption Behaviour in Zambia: The Link to Poverty Alleviation?
8. Regulation of the Electricity Industry in Bolivia: Its Impact on Access to the Poor, Prices and Quality
9. MULTIMODAL SEMIOTICS OF SPIRITUAL EXPERIENCES: REPRESENTING BELIEFS, METAPHORS, AND ACTIONS
10. The name is absent