Figure 6
Yield Curve Residuals, 1985.01 - 2000.12
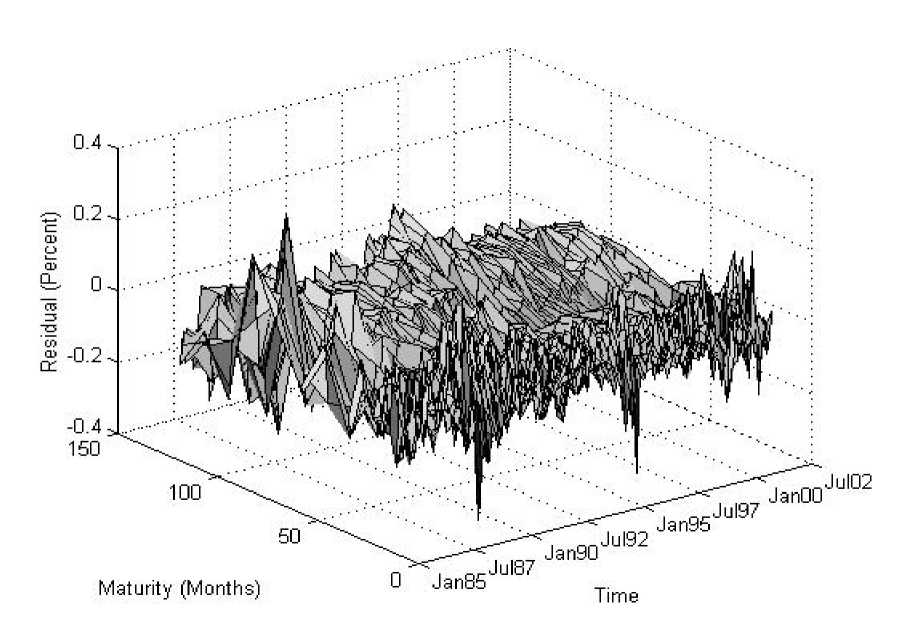
Notes to Figure 6: We plot residuals from Nelson-Siegel yield curves fitted month-by-month. See text for
details.
More intriguing information
1. CAN CREDIT DEFAULT SWAPS PREDICT FINANCIAL CRISES? EMPIRICAL STUDY ON EMERGING MARKETS2. FDI Implications of Recent European Court of Justice Decision on Corporation Tax Matters
3. The name is absent
4. The name is absent
5. An Incentive System for Salmonella Control in the Pork Supply Chain
6. The open method of co-ordination: Some remarks regarding old-age security within an enlarged European Union
7. Strategic monetary policy in a monetary union with non-atomistic wage setters
8. The growing importance of risk in financial regulation
9. Bridging Micro- and Macro-Analyses of the EU Sugar Program: Methods and Insights
10. The name is absent