Positive growth (decline) is indicated by positive (negative) value. Unlike the Malmquist
index, the Luenberger productivity indicator is additively decomposed as follows:
L(zt,zt+1)=[Dt(z;g)-Dt+1(zt+1;g)]+
2 [Dt+ι (zt+ι ; g)- Dt (zt+1 ; g)+Dt+ι (zt ; g)- D(zt ; g)], (6)
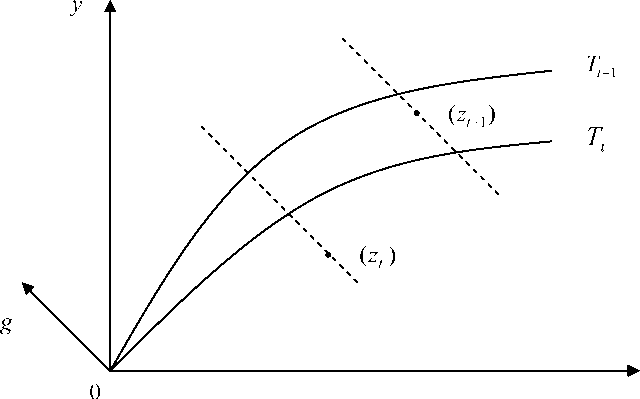
where the first term (inside the first brackets) measures efficiency change between time
periods t and t+1 while the arithmetic mean of the difference between the two figures inside
the second brackets expresses the technological change component, which represents the shift
of technology between the two time periods. This decomposition was inspired by the
breakdown of the Malmquist productivity index in Fare et al. (1989). For a complete
overview of the decompositions of productivity measures, see Grosskopf (2003). Figure 1
illustrates the Luenberger productivity indicator.
Figure 1: The Luenberger productivity indicator
Finally, in an aggregate context, following Farrell (1957) and Briec et al. (2003), we
use an aggregate directional distance function constructed as:
(
Dt ∣∑ xk, ∑ ʃkl. (7)
V k=1 k=1 J
More intriguing information
1. An Incentive System for Salmonella Control in the Pork Supply Chain2. A Study of Adult 'Non-Singers' In Newfoundland
3. THE ECONOMICS OF COMPETITION IN HEALTH INSURANCE- THE IRISH CASE STUDY.
4. MULTIMODAL SEMIOTICS OF SPIRITUAL EXPERIENCES: REPRESENTING BELIEFS, METAPHORS, AND ACTIONS
5. Consumer Networks and Firm Reputation: A First Experimental Investigation
6. The Shepherd Sinfonia
7. Sector Switching: An Unexplored Dimension of Firm Dynamics in Developing Countries
8. Licensing Schemes in Endogenous Entry
9. On s-additive robust representation of convex risk measures for unbounded financial positions in the presence of uncertainty about the market model
10. Optimal Vehicle Size, Haulage Length, and the Structure of Transport Costs