43
The income gap can be measured for three groups: all persons 15 and over, persons with
employment income, and persons who worked full-time full year. These latter two groups are of
course sub-sets of the first group, and the third group is a sub-set of the second group.
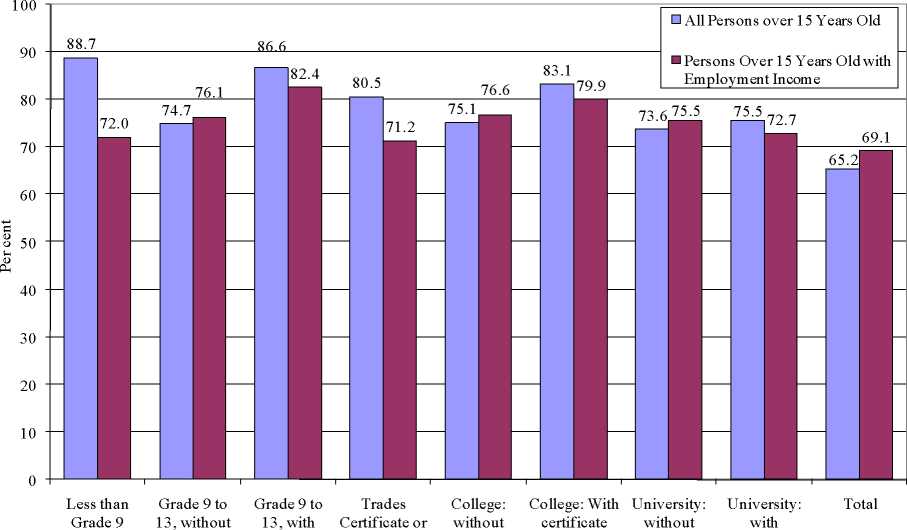
The largest of the employment income gaps is for all persons (65.2 per cent) and reflects
the lower employment rate for Aboriginal Canadians relative to non-Aboriginal Canadians, in
turn driven by the limited employment opportunities in rural and remote areas where many
Aboriginal Canadians reside. The second largest employment income gap is for persons with
employment income (69.1 per cent). This reflects the greater proportion of Aboriginals who have
seasonal employment, again due to limited year round employment opportunities. The
employment gap for full-year, full-time persons is the smallest but still substantial at 80.7 per
cent. The factors behind this gap, other than educational attainment, are less obvious.
i. Situation in 2001
The income of Aboriginal Canadians is well below that of the non-Aboriginal population
and is at the root of the much higher Aboriginal poverty rate. The low Aboriginal income in
Canada can in part be attributed to lower levels of education. As discussed earlier in the paper,
education and income are positively correlated. Higher levels of education usually translates into
higher income, and this is also true for the Aboriginal population.
Chart 9: Average Employment Income of the Aboriginal Population, as a
Share of non-Aboriginal Income, 2001
Source: Census 2001
certificate certificate
Diploma certificate
certificate
certificate
More intriguing information
1. The name is absent2. The name is absent
3. Wage mobility, Job mobility and Spatial mobility in the Portuguese economy
4. Correlation Analysis of Financial Contagion: What One Should Know Before Running a Test
5. The name is absent
6. Valuing Access to our Public Lands: A Unique Public Good Pricing Experiment
7. The name is absent
8. Density Estimation and Combination under Model Ambiguity
9. The name is absent
10. A NEW PERSPECTIVE ON UNDERINVESTMENT IN AGRICULTURAL R&D